UNITED STATES
SECURITIES AND EXCHANGE COMMISSION
Washington, D.C. 20549
SCHEDULE 14A
(Rule 14a - 101)
Proxy Statement Pursuant to Section 14(a) of the
Securities Exchange Act of 1934
Filed by the Registrant x
Filed by a Party other than the Registrant o
Check the appropriate box:
|
| |
ox | Preliminary Proxy Statement |
| o | Confidential, For Use of the Commission Only (as permitted by Rule 14a-6(e)(2)) |
xo | Definitive Proxy Statement |
| o | Definitive Additional Materials |
| o | Soliciting Material Pursuant to §240.14a-12 |
Herman Miller, Inc.
(Name of Registrant as Specified In Its Charter)
(Name of Person(s) Filing Proxy Statement, if other than the Registrant)
Payment of Filing Fee (Check the appropriate box):
|
| | |
| x | No fee required. |
| | |
| o | Fee computed below per Exchange Act Rules 14a-6(i)(1) and 0-11. |
| | |
| | (1) | Title of each class of securities to which transaction applies: o |
| | (2) | Aggregate number of securities to which transaction applies: o |
| | (3) | Per unit price or other underlying value of transaction computed pursuant to Exchange Act Rule 0-11 (set forth the amount on which the filing fee is calculated and state how it was determined): o |
| | (4) | Proposed maximum aggregate value of transaction: o |
| | (5) | Total fee paid: o |
| | | |
| o | Fee paid previously with preliminary materials. |
| | |
| o | Check box if any part of the fee is offset as provided by Exchange Act Rule 0-11(a)(2) and identify the filing for which the offsetting fee was paid previously. Identify the previous filing by registration statement number, or the Form or Schedule and the date of its filing. |
| | |
| | (1) | Amount Previously Paid: |
| | (2) | Form, Schedule or Registration Statement No.: |
| | (3) | Filing Party: |
| | (4) | Date Filed: |
August 30, 201628, 2018
Dear Shareholder,
On February 5, 2018, Herman Miller announced that Brian C. Walker planned to retire as President and Chief Executive Officer and a member of our Board of Directors by August 31, 2018. Following the announcement, our Board established a CEO Search Committee composed of independent directors to identify and evaluate internal and external candidates. To begin the search process, the Search Committee created a CEO profile outlining desired qualities relating to cultural fit and leadership style, differentiating competencies, motivational fit and experience.
To assist in identifying potential candidates based on the desired CEO profile, the Search Committee selected the search firm of Korn Ferry, who identified a number of external candidates. Upon evaluation of the final slate of impressive candidates, the Search Committee selected Ms. Andrea Owen as its recommendation to the Board of Directors to become the new President and Chief Executive Officer and a member of the Board of Directors. After careful consideration, the Board approved the Search Committee’s recommendation.
Prior to joining Herman Miller, Ms. Owen enjoyed a 25-year career at Gap Inc., where she most recently served as Global President of Banana Republic, a division of Gap Inc., leading 11,000 employees across over 600 wholly-owned and franchise specialty and outlet stores in over 27 countries. During her tenure at Gap, her career spanned many verticals and brands within the global business. She developed a diversified skillset that aligns with the strategic direction of Herman Miller today, ranging from digital and omnichannel transformation to design, product development and supply chain management. Ms. Owen achieved impressive results with a strong focus on building people-first teams centered on the values shared by Herman Miller today. Her background demonstrates that she will be able to effectively serve as a market visionary, performance strategist, change sponsor and organization builder at Herman Miller.
As we look ahead, Ms. Owen will be focused on solidifying the momentum of our business and identifying opportunities that will lead to growth in new markets for both contract and consumer customers. The Board and I are confident that Ms. Owen, in partnership with our existing leadership team, is the perfect candidate to take our portfolio of brands to the next level and to seize opportunities that will ultimately unearth long-term value for our shareholders.
Please join me in welcoming Ms. Owen to the role and we thank you for your continued commitment to Herman Miller.
Sincerely,
Michael A. Volkema
Chairman of the Board
August 28, 2018
Dear Fellow Herman Miller Shareholder,
It’s no coincidence that over the last 50For several years now, we’ve had a clear vision to transform Herman Miller has been at the centerinto a global provider of virtually every game-changing innovation the office furniture industry has seen - and we’re just getting started. At the heart of Herman Miller has always been a culture motivated by a sense of purpose and ownership; and driven to create inspiring designs to help people do great things. AsWe have focused on expanding our addressable markets and creating new channels of distribution to serve our customers. This strategy includes five key priorities, which I will provide an update on shortly. Achieving this vision requires imagination, stretches our resources, and pulls us to constantly re-examine what we lookdo and how we do it. I’m proud that Herman Miller’s 8,000 employees continue to respond with the future, we’ve combinedspirit and creativity that have propelled Herman Miller for more than 100 years.
Sales of $2.38 billion for fiscal 2018 marked a powerful familyrecord level for the third year in a row and reflected growth across each of our business segments. The organization did a great job of managing operating expenses over the full year, helping to mitigate gross margin pressures. We reported EPS on a GAAP basis of $2.12 for fiscal 2018, and adjusted EPS of $2.30(1) increased by 6% over the prior year. Reflecting the strength of our current financial position and confidence in our growth strategy, we announced a 10% dividend increase in July.
Our business and the realities our customers face continue to evolve. The following five key priorities aim to help us create value for both our customers and Herman Miller, and we made meaningful progress on each of them over the past year.
Realize the Living Office
The Living Office is a research-based framework to help our customers design compelling, high-performing work spaces and a critical foundation for setting our innovation agenda and leveraging our dealer eco-system. In the past year, we added significantly to our research into workplace environments, and through a combination of partnerships and a new range of technology-focused work space settings, we are integrating technology more powerfully than ever before. We also launched the Live OS technology platform to improve workplace performance and help achieve wellness goals with real-time data.
Deliver Innovation
Innovation remains at the forefront for Herman Miller. Sales from new products in 2018 reflected 29% of total sales for the year, well above our annual target of 20%. We launched 46 new products in the past year and announced a number of upcoming launches at the NeoCon industry tradeshow this past June. These launches included Cosm, a performance task chair designed by our long-time design partner in Berlin, Studio 7.5., that won a Best of NeoCon Gold award in the ergonomic seating category for its innovative design. Altogether, our new products have the Herman Miller and dealer sales teams energized and well-positioned for the opportunities ahead.
Leverage our Dealer Eco-system
Strengthening our dealer eco-system remains a focal point. We expanded our product offerings into growing categories like performance seating and enclosures. The seating launches of Cosm, Verus, and Lino expand our leading line-up of seating designs. With the recently announced investment in Maars Living Walls, a global leader in interior wall solutions; the launch of Overlay, a system of sub-architectural, moveable walls; and an alliance with Framery, a provider of high performance soundproof enclosures, we have made a strong push into the enclosures category. The Herman Miller Elements team continues to help our dealers fully understand the breadth of our offering across the Herman Miller group of brands a commitmentin the fast-growing ancillary space. To further support our dealers, we’ve made significant progress this year enhancing our digital tools to innovationmake it as easy as possible for dealers to order, specify, and an unrivaled global distribution channelvisualize the entire product offering across all of our group of brands. We’ll continue to position ourselvesenhance these tools with new search and visualization features planned for growth.the year ahead.
Scale our Consumer Business
Fiscal 20162018 was a year of significant accomplishments towardsgreat progress scaling our long-term goals. WeConsumer business. Revenues grew by 12% over last year, as comparable brand sales increased saleseach quarter and we expanded selling space by 40,000 square feet. Our mix of exclusive modern designs also continues to grow. Finally, our June investment in fiscal 2016HAY, a Denmark-based design leader in ancillary furnishings in Europe and Asia, supports our priorities around scaling our Consumer business and the Dealer Eco-System. Active in both the contract and residential furnishing markets, the HAY brand expands our portfolio of leading global brands and allows us to scale the Consumer business by 5.7% to $2.26 billion, an all-time record level of sales for our company,accessing a growing customer base that prizes both industry-leading design and grew adjusted earnings per share by 19%(1) compared to last year. These results are a clear tribute to the talent and effort of our people. I would like to highlight the meaningful progress we made on a number of important priorities during the past year.
Expand sales knowledge base
value. Over the past few years we have significantly increased the breadth of our solution set to respond to the changing landscapecourse of the modern work place. This pastcoming fiscal year, we made a significant investment in training and education for our dealers, and sales and design professionals. Specifically, we created and implemented a series of “Bootcamps” that markedly increased our commercial teams’ knowledge of our expanded offer and provided the tools they need to win.
Align sales deployment model
Next, we re-engineered our sales deployment model to ensure we are best aligned to serve our dealers and increase our share of their business. To get there, we developed and launched a new Channel Sales Manager role and team. This team is responsible for the geographic deployment of all of our brands and capabilities to our dealers. We are really excited by the early progress of this team and think it holds great promise.
We reorganized our sales efforts around Healthcare, Government and Education; changes that led to better coverage of opportunities and better alignment of skill sets, enabling us to put additional resources on the largest healthcare and government organizations. We’ve already seen results, and these changesHAY’s goods will pay great dividends as we offer all of Herman Miller's expanded capabilities to these large and complex organizations.
Increase innovationbe available through enhanced new product commercialization process
Given our expanded, addressable market and the accelerated pace of change in our customers lives, we need to increase the size of our innovation pipeline and reduce our time to market. To achieve this objective, we began the implementation of a plan that includes the creation of an “innovation kitchen” to increase our ability to source and evaluate innovative ideas. In addition, we streamlined our organizational structure and processes for managing our new product commercialization process. We believe these changes will increase the speed of decision- making and ensure we have improved balance between short cycle product improvements, new platforms and breakthrough innovation. This year at NeoCon, we launched in excess of 20 new products, including products from our R&D studios in Herman Miller, Geiger, The Collection, Nemschoff, Herman Miller U.K., and Maharam. The breadth and quality of this work was impressive, and we were recognized with a number of awards. Even more important, we have a robust pipeline full of new ideas that will continue to produce new products for us over the coming years.
In addition to reorganizing internal development, we recently announced a strategic partnership with U.K.-based, Naughtone. This partnership will augment our offering of furnishings for areas in work environments beyond our historical focus on individual work stations. Naughtone will also add to the operational capabilities needed to serve the EMEA region.
Enrich the way customers experience Herman Miller
We have been implementing a multi-year plan to create the best customer experience in our space. This includes a dealer branding campaign, upgrades to our global showroom portfolio and converting our Design Within Reach studio portfoliochannels. HAY products will also be integrated into the contract furnishings business across our dealer network as part of the Herman Miller family of brands.
Drive Profit Optimization
We made progress this year on our corporate-wide profit optimization goal, our fifth strategic priority. Given inflationary pressures over the past year, this work, combined with pricing actions we implemented in the third quarter of fiscal 2018 and a planned price increase in January of 2019, is proving to be critical to helping to address those pressures and drive improvements in operating margins. Across three phases of work
that are in progress, we are building line of sight toward achieving between $60 million and $90 million of profit optimization, including run rate savings of approximately $30 million that we have generated to date.
Let me provide more perspective on each of the phases. The initial corporate-wide push that we began 18 months ago has generated a larger footprint.run-rate of $23 million of annual savings to date and we believe will realize another $5 million from our recent manufacturing consolidation efforts. In August of 2017, we also began a focused initiative aimed at profit optimization within our Consumer business. We believe we can drive $15 million to $20 million of profit improvement in the Consumer segment as part of our drive to achieve sustained operating margins of 8% to 10% in that business. This includes $2 million of initial benefits realized in the fourth quarter in fiscal 2018. As most of the benefits of the work to date have been offset by increased inflation and discounting, we have recently increased the scope of our efforts to include the North America business. While we are still in the opportunity confirmation stage, we see the potential for $20 million to $40 million of benefit based on the distinct work streams identified to date. All together, these phases will be critical in helping us fund growth initiatives, offset potential inflationary pressures and, ultimately, achieve or exceed our goal of consolidated operating margins of 10% by the end of this fiscal year 35%2020.
We made important progress on all five strategic priorities in the past year. As we enter fiscal 2019 with tremendous momentum toward delivering sustainable, profitable growth for our stakeholders, these five priorities will remain a focus for us. At the same time, we will support these priorities with three additional areas that will require our attention, effort and investment.
First, we must increase our efforts and commitment toward building an inclusive and diverse culture. Diverse perspectives, thoughts, and experiences are critical to attracting and keeping the best talent, as well as to understanding the diverse perspectives and needs of our United States dealers had implementedcustomers. While this is not new to us, we are committed to continuing to grow in this area. We’re building intentionality and purpose into everything we do to ensure we’re creating systems that afford every person at Herman Miller the new brand standardsopportunity to achieve their full potential.
The second area we are ramping up is modernizing our manufacturing capabilities. The first step is to stabilize our core competencies and bring our capacities in their markets. Last year,line with market demands. This work is well underway. We’re in the process of resetting our footprint in China by consolidating the Dongguan and Ningbo plants, and in the U.S., we reset eachhave approved nearly $100M in investments to modernize our capabilities. Along with stabilizing our core, we must also further integrate technology with our manufacturing equipment and processes. Increasing computing power, combined with proven manufacturing techniques, will help us redefine what’s possible. We’ll build the next stage of our global showroomslean journey by incorporating automation into all of our thinking.
Last, and a more long-range objective, is “becoming a digital enterprise.” This begins with a shift in perspective. Our information technology teams are moving from a “boxes and wires” focus to reflect our best thinking of what is required to create an inspiringhelping drive growth as digital business partners. This work placewill build on the progress we have already made and demonstrate our expanded portfolio of solutions. This past year,will happen in four areas. First, we opened new showrooms in Washington, D.C.are simplifying and New York. The New York showroom is our first flagship location and unites our Herman Miller, Geiger, Collection and Maharam brands. This location includesexpanding the first Herman Miller branded retail studiodigital highway in the United Statesdealer eco-system. Second, we are expanding our digital service offering with platforms like Live OS. Third, artificial intelligence, data, and serves asvisualization tools will help us become better at core competencies like customer service, training, and design. Finally, technology will help us with the home for our talented team in this region.modernization of manufacturing.
PositionConsidering the Consumer business for future growth
While we experienced growing pains in our Consumer business this yearwide and have more work to do, we continue to believe the strategic drivers that led us to invest in this segment are a great opportunity for us. These factors include the convergencedeep array of workproducts, capabilities, and home environments, the power of a multi-channel capability to increase our addressable market, and the permission consumers have givenbrands now available from the Herman Miller brand to serve them.
A numberGroup and a clear set of actions this year havepriorities for the work ahead of us, well-positioned to connect with consumers and growwe’re more confident than ever in this market. A core partour future. The diversity of our Consumer strategy continues to beportfolio and the transformation of our Design Within Reach studio portfolio. The primary objective is to improve the customer experience with larger studios that enable the customer to envision a modern living environment and showcase our expanded portfolio of products. This past year, we opened new studios in Scottsdale, Arizona, and Berkley, California. To be frank, this was below our plan of opening six new studios. Overall the number of studios declined this past year from 33 to 29,and our total square footage was essentially flat. Whilecapabilities we are never happy missing an objective, we believebuilding within the team made the right long-term decision to be selective about location, and they’ve built a strong backlog of new studios to open over the next 12 to 18 months. We enter fiscal 2017 with nine new or expanded studios under contract and in our plans.
We made significant investments in brand awareness and customer acquisition. These efforts included a mobile-optimized web platform and rolling out a new sourcebook to highlight the breadth of our offer for the design trade channel. We have also started to introduce the Design Within Reach offer to our contract dealers. In addition, we have taken proactive steps to improve the effectiveness of our catalog program, which continues to be an important driver of customer acquisition.
Finally, we implemented a new ERP system during the second quarter of the year. We believe this investment, along with improvements we are making in logistics, will improve efficiency, enable our sales professionals to better serve their customers, and improve the customer’s experience from purchase to delivery.
New and enhanced operational capabilities
We opened new operational facilities in the United Kingdom and India to improve operational efficiency and our ability to serve customers and dealers in EMEA and Asia. In Melksham, U.K., our new Portal Mill facility combines manufacturing and distribution under one roof, replacing the buildings we had outgrown in Bath and Chippenham. Over the past few years, we have built a strong dealer channel to serve the fast growing Indian market. This past year we opened a new manufacturing and distribution facility in Bangalore, India, to complement our regional manufacturing capabilities in China. This capabilityHerman Miller community will enable us to improveprovide our response timecustomers with the most comprehensive solutions to customersmeet their needs in working, living, healing, and improvelearning environments.
On a personal note, as Herman Miller moves with commitment toward the competitiveness of our offer.
Deliver on the promise of Living Office
We made a number of steps which will enable us to deliver on the promise of the Living Office, our comprehensive approach to workplace design. We began to roll out a number of case studies that demonstrate how the application of the Living Office can improve our customers' businesses and the lives of their people. One very promising new facet of our ability to deliver Living Offices involves connecting people and organizations digitally with their workplace. We developed a number of new products and partnerships that will enable us to deliver on our strategy of the connected and quantified office: Smart Furnishings, Smart Settings, and Smart Places. These intriguing new products and digital connections combine productivity with better health, put in place customized adjustments at the work station level, and allow individuals to use our products-especially their ergonomic features-with much greater effect. We envision dashboards that provide organization’s analytics on the health of employees and the utilization of facilities. These capabilities, combined with our growing breadth of solutions beyond the workstation, significantly enhanced our ability to deliver on the promise of the Living Office we introduced four years ago.
Taking our Shift strategy togoals mentioned above, a new level
FiveCEO will see us achieve them. After a career of 29 years ago we beganand a tenure of 14 years as CEO, I will be retiring in August 2018. My time at Herman Miller has been an inimitable period of wonderful relationships, great personal growth, and tremendous learning. I’m humbled to pursuejoin the list of Herman Miller leaders, and I’m still awed by the chance I was given to help this great community change and grow. With the announcement of Andrea Owen as the next CEO of Herman Miller, I am looking forward to working with Andrea through a strategy we called Shift. We adopted this strategy in viewseamless transition. Herman Miller is only just beginning to scratch the surface of enormous and dramatic changes in the ways people work, changes in demographics, technological changes, and changes in our markets. In retrospect, the key changes we anticipated have indeed played out, and they continue to gain strength and impact on our and our customers’ worlds. Our strategy envisioned four shifts we had to make for us to navigate these changes:
From product focus to complete solutions;
From North America-centric to global;
From office products to products for everywhere;
From an industry brand to an industry + consumer brand.
These shifts required us to change our perspective on our business, on our geographies, on our customers and on the ways we portrayed Herman Miller’s products, business and community to the world. These four shifts remain our north star.
This year we have added one additional shift-Product Marketing to Pull Marketing-that we believe is required for us to reach the full velocity of our transformation. In other words, we believe this additional shift will put our strategy into Overdrive, and that is what we have renamed our strategy.
Our performance over the past five years gives us confidence that we are headed in the right direction. We have enlarged our addressable market by almost 50%opportunity. Andrea’s experience driving results as a seasoned leader, coupled with our outstanding leadership team, will take our family of brands to $35 billion in the past five years. We have a unique and incredibly strong global distribution channel in 109 countries, consisting of over 600 dealers, 29 studios, and a growing e-commerce connection to consumers. We have a consistent global brand presence reflected in our buildings, showrooms, retail studios and dealers. We have solidified our position as one of the leaders in design around the world. Now, with all of these major building blocks in place, we believe we can build on our position and achieve sustained levels of growth in sales and profitability.next level.
An ongoing sense of purpose and commitment
Over the last century, Herman Miller has come to stand for many things. Chief among these are a thoughtful, human-centered approach to modern design; revolutionizing the ways people work, learn, heal and live; doing our best for the environment; and thinking differently about how a company and its leaders can serve the people who make it up. These qualities and our ongoing aspiration to exemplify them at Herman Miller will not change.
As we continue our transformation to a modern lifestyle company connected to consumers and organizations around the world, we will bring all the talents and skills of the 8,000 Herman Miller employees to bear on our goals. We promise to pursue our mission-inspiring designs to help people do great things. And we strongly believe that fulfilling our mission will lead us to achieving the goals we have set.
Thanks, as always,Thank you for your faithfulongoing support and interest through your ownership of Herman Miller. I believewish this stage ofcommunity called Herman Miller’s impressive history is one ofMiller only the most exciting periods yet.
best in the future.
Sincerely,
Brian C. Walker
President and Chief Executive Officer
Notice of Annual Meeting of Shareholders
The Annual Meeting of the Shareholders of Herman Miller, Inc. (the “Company”) will be held on October 10, 2016,8, 2018, by means of remote communication on the Internet at www.virtualshareholdermeeting.com/MLHR16,MLHR18, at 10:30 a.m. (ET) for the following purposes:
| |
| 1. | To elect four directors, each for a term of three years |
| |
| 2. | To approve an amendment to our Articles of Incorporation to allow our by-laws to provide for a majority voting standard for the election of directors in uncontested elections |
| |
| 3. | To ratify the appointment of Ernst & Young LLP as our independent registered public accounting firm |
| |
3.4. | To vote, on an advisory basis, to approve the annual compensation paid to the Company'scompany's named executive officers |
| |
4.5. | To transact such other business as may properly come before the meeting or any adjournment thereof |
Shareholders of record at the close of business on August 12, 2016,10, 2018, will be entitled to vote at the meeting.
Please note that this year's Annual Shareholders' Meeting will be held via the Internet only. The accompanying proxy materials include instructions on how to participate in the meeting and the means by which you may vote your shares of Companycompany stock.
We encourage you to vote your Proxy, at your earliest convenience, by one of the following means:
By visiting www.proxyvote.com on the Internet
And if you request paper materials:
By calling (within the U.S. or Canada) toll free at 1-800-690-6903; or
By signing and returning your Proxy card
You may also vote at the meeting via the internet by visiting www.virtualshareholdermeeting.com/MLHR16MLHR18 and following the instructions. Regardless of whether you expect to attend the meeting through the Internet, please vote your shares in one of the ways listed above.
By order of the Board of Directors
H. Timothy Lopez, Secretary
August 30, 201628, 2018
Table of Contents
|
| |
| | Page No. |
| Solicitation of Proxies and Voting (Q&A) | |
| Proxy Statement Summary | |
Financial Highlights from 20162018 | |
| Proposal #1 - Election of Directors | |
| Corporate Governance and Board Matters | |
| Board Committees | |
| Proposal #2 - Approval of Amendment to Articles of Incorporation | |
| Proposal #3 - Ratification of Appointment of Independent Registered Public Accounting Firm | |
| Report of the Audit Committee | |
Proposal #3#4 - Proposal to Approve, on an Advisory Basis, the Annual Compensation Paid to the Company's Named Executive Officers | |
| Voting Securities and Principal Shareholders | |
| Director and Executive Officer Information | |
| Compensation Discussion and Analysis | |
| Executive Compensation Committee Report | |
| Summary Compensation Table | |
| Grants of Plan-Based Awards | |
| Outstanding Equity Awards at Fiscal Year-End | |
| Option Exercises and Stock Vested | |
| Pension Benefits | |
| Nonqualified Deferred Compensation | |
| Potential Payments upon Termination, Death, Disability, Retirement or Change in Control | |
| Director Compensation | |
| Equity Compensation Plan Information | |
| Section 16(a) Beneficial Ownership Reporting Compliance | |
| Certain Relationships and Related Party Transactions | |
| Reconciliation of Non-GAAP Financial Measures | |
Submission of Shareholder Proposals for the 2017 Annual Meeting | |
| Miscellaneous | |
Herman Miller, Inc.
855 East Main Avenue
PO Box 302
Zeeland, Michigan 49464-0302
Proxy Statement Dated August 30, 201628, 2018
This Proxy Statement and the accompanying Proxy, which we are making available to shareholders on or about August 30, 2016,28, 2018, are furnished to the shareholders of Herman Miller, Inc. in connection with the solicitation by the Board of Directors of proxies to be used at the Annual Meeting of Shareholders. This meeting will be held on October 10, 2016,8, 2018, at 10:30 a.m. (ET). Please note that this year's Annual Meeting will once again be held via the Internet rather than in person.
What is a proxy?
A proxy is your authorization for someone else to vote your shares for you in the way that you want to vote and allows you to be represented at our Annual Meeting if you are unable to attend the meeting. When you complete and submit a proxy card or use the automated telephone voting system or the Internet voting system, you are submitting a proxy. As used in this proxy statement,Proxy Statement, the terms “the Company,company,” “we,” “our” and “us” all refer to Herman Miller, Inc. and its subsidiaries.
What is a proxy statement?Proxy Statement?
A proxy statementProxy Statement is a document the United States Securities and Exchange Commission (“SEC”) requires to explain the matters on which we are asking you to vote at our Annual Meeting by proxy and to disclose certain information that may be helpful to you in deciding how to vote. This proxy statementProxy Statement was first made available to the shareholders on or about August 30, 2016.28, 2018.
Why am I receiving my proxy materials electronically instead of receiving paper copies through the mail?
We are furnishing proxy materials to our shareholders primarily via the Internet, instead of mailing printed copies of the proxy statementProxy Statement and annual report.Annual Report. This supports our on-going commitment to sustainability by reducing the amount of paper needed to produce this reportcirculate the proxy material and at the same time reducesreducing our costcosts associated with mailing the proxy materials to shareholders.
On or about August 30, 2016,28, 2018, we mailed to our shareholders of record (other than those who previously requested electronic delivery) a Notice of Internet Availability of Proxy Materials containing instructions on how to access this proxy statementProxy Statement and our annual reportAnnual Report online. If you received a Notice of Internet Availability of Proxy Materials by mail, you will not receive a printed copy of the proxy materials in the mail. The Notice of Internet Availability of Proxy Materials instructs you how to electronically access and review all of the information contained in this proxy statementProxy Statement and the annual report,Annual Report, and it provides you with information on voting.
If you received a Notice of Internet Availability of Proxy Materials by mail and would like to receive a paper copy of our proxy materials, follow the instructions contained in the Notice of Internet Availability of Proxy Materials about how you may request to receive your materials in printed form on a one-time or ongoing basis.
Where is this year’s proxy statementProxy Statement available electronically?
You may view this proxy statementProxy Statement and the 2016 annual report2018 Annual Report electronically by going to www.proxyvote.com.
Who can vote?
Only record holders of our common stock at the close of business on August 12, 201610, 2018 can vote at the Annual Meeting. We refer to that date as the Record Date for the meeting. Each shareholder of record has one vote, for each share of common stock owned, on each matter presented for a vote at the Annual Meeting.
What is the difference between a shareholder of record and a “street name” holder?
If your shares are registered directly in your name on the records of our transfer agent, then you are the shareholder of record with respect to those shares.
If your shares are held in a stock brokerage account or by a bank or other nominee, then the brokerage firm, bank or other nominee is considered to be the shareholder of record with respect to those shares. However, you still are considered the beneficial owner of those shares, and your shares are said to be held in “street name.” Street name holders generally cannot vote their shares directly and must instead instruct the brokerage firm, bank or other nominee how to vote their shares. See “How can I vote?” below.
How can I vote?
If your shares are held in “street name,” follow the instructions provided by your brokerage firm, bank, or other nominee. If your shares are registered directly in your name on our records, you can vote in one of four ways:
Via Internet before the Annual Meeting: Go to www.proxyvote.com and follow the instructions. You may do this at your convenience, 24 hours a day, 7 days a week. You will need to have your proxy card or Notice of Internet Availability of Proxy Materials in hand. The deadline for Internet voting is 11:59 p.m., Eastern Time, October 9, 2016.7, 2018.
By Telephone: CallIf you have requested paper materials, call toll-free 1-800-690-6903 and follow the instructions. You may do this at your convenience, 24 hours a day, 7 days a week. You will need to have your proxy card or Notice of Internet Availability of Proxy Materials in hand. The deadline for voting by phone is 11:59 p.m., Eastern Time, October 9, 2016.7, 2018.
In Writing: If you received a proxy card, complete, sign, and date the proxy card and return it in the return envelope that we provided with your proxy card.
At the Annual Meeting: Log on to the Internet at www.virtualshareholdermeeting.com/MLHR16.MLHR18. At this site, you will be able to vote electronically. You will also be able to submit questions.
If you submit a proxy to the Companycompany before the Annual Meeting, whether by proxy card, by telephone or by Internet, the persons named as proxies will vote your shares as you direct. If no instructions are specified, the proxy will be voted for the four directors nominated by the Board of Directors; for the proposal to approve an amendment to our Articles of Incorporation to allow our by-laws to provide for a majority voting standard for the election of directors in uncontested elections; for the ratification of the appointment of Ernst & Young LLP as the Company’scompany’s independent registered public accounting firm for the fiscal year ending June 3, 20171, 2019; and for the non-binding advisory proposal to approve the compensation of our Named Executive Officers.
Can I revoke my proxy?
You may revoke a proxy at any time before the proxy is exercised by:
(1) delivering written notice of revocation to the Corporate Secretary of the Company,company, 855 East Main Street, P.O. Box 302, Zeeland, Michigan 49464-0302;
(2) submitting another properly completed proxy card that is later dated;
(3) voting by telephone at a subsequent time;
(4) voting via the Internet at a subsequent time; or
(5) voting at the Annual Meeting.
If you hold your shares in “street name,” you must vote your shares in the manner that your brokerage firm, bank or other nominee has prescribed.
How many votes do we need to hold the Annual Meeting?
To carry on the business of the meeting, we must have a quorum. This means that at least a majority of the shares that are outstanding and entitled to vote as of the Record Date must be present in person or by proxy.
Shares are counted as present at the meeting if the shareholder either:
has properly submitted a signed proxy card or other form of proxy (through the telephone or Internet); or
Isis present at the Annual Meeting and votes electronically at the meeting.
On the Record Date, there were 60,010,54059,497,056 shares of common stock issued and outstanding. Therefore, at least 30,005,27029,748,529 shares need to be present at the Annual Meeting.
What matters will be voted on at the meeting?
We are asking you to vote on: (i) the election of four directors to serve three-year terms expiring in 2019;2021; (ii) a proposal to approve an amendment to our Articles of Incorporation to allow our by-laws to provide for a majority voting standard for the election of directors in an uncontested election: (iii) the ratification of the appointment of Ernst & Young LLP as our independent registered public accounting firm for the fiscal year ending June 3, 20171, 2019; and (iii)(iv) a non-binding advisory proposal on the compensation of our Named Executive Officers, otherwise known as a “say-on-pay” proposal. We describe these matters more fully in this proxy statement.Proxy Statement.
How many votes are needed for each proposal?
Except with respect to the election of directors and approval of the amendment to our Articles of Incorporation to allow our by-laws to provide for a majority voting standard for the election of directors in uncontested elections, a majority of votes cast at the meeting will approve each matter that arises at the Annual Meeting.
The directors are elected by a plurality of votes.votes cast. This means that the four individuals receiving the highest number of votes cast “for” their election will be elected as directors of the Company.company. A “withhold authority” vote will have no effect on the election of a particular nominee. However, our Board's Governance Guidelines include a form of majority voting for directors. Under the Governance Guidelines, in an election where the only
nominees are those recommended by the Board, any director who receives a greater number of votes "withheld" than those "for" must tender his or her resignation. Under the Guidelines, the Nominating and Governance Committee will consider the resignation and recommend to the Board whether to accept or reject the tendered resignation. The Board must act on the resignation no later than 90 days after certification of the shareholder vote at the meeting. The Companycompany will publicly disclose the Board's decision whether to accept any resignation or the reasons for rejecting the resignation, if applicable.
The amendment to our Articles of Incorporation to allow our by-laws to provide for a majority voting standard for the election of directors will be approved if it receives the affirmative vote of a majority of the outstanding shares entitled to vote on the proposed amendment.
If your shares are held by a broker, bank or other nominee, the holder of your shares cannot vote your shares on the election of directors, the proposal to amend our Articles of Incorporation, or the say-on-pay vote unless it has received voting instructions from you. Each of these matters is considered a non-routine matter, and if you fail to provide instructions, the result is a “broker non-vote”.
Abstentions and broker non-votes are counted for the purpose of determining the presence or absence of a quorum. Abstentions and broker non-votes are not, however, counted as votes cast on matters submitted for shareholder vote. However, abstentions and broker non-votes have the effect of a vote "against" the amendment to our Articles of Incorporation to allow our by-laws to provide for a majority voting standard for the election of directors.
What happens if a nominee is unable to stand for re-election?
The Board may, by resolution, provide for a lesser number of directors or designate a substitute nominee. In the latter case, shares represented by proxies may be voted for a substitute nominee. Proxies cannot be voted for more than four nominees. We have no reason to believe any nominee will be unable to stand for re-election.
What alternatives do I have in voting on each of the proposals?
Except with respect to the election of directors, you may vote “for,” “against,” or “abstain” on each proposal. In the election of directors, you may vote “for” or “withhold authority to vote for” each nominee.
Will the Annual Meeting be Webcast?
Yes. You may attend and participate in the Annual Meeting by logging onto the Internet at www.virtualshareholdermeeting.com/MLHR16.MLHR18. At this site, you will be able to vote electronically and submit questions during the meeting. You will need the 12-digit16-digit control number that you received with your proxy card or Notice of Internet Availability to enter and attend the meeting.
Where do I find the voting results of the meeting?
If available, we will announce voting results at the Annual Meeting. We will also disclose the voting results on a Current Report on Form 8-K that we will file with the SEC within four business days after the meeting.
Important Notice Regarding the Availability of Proxy Materials for the Shareholders Meeting to be Held on October 10, 20168, 2018
This proxy statementProxy Statement along with our annual reportAnnual Report are available at: www.proxyvote.com.
You may obtain a copy of the Company’scompany’s Annual Report on Form 10-K for the fiscal year ended May 28, 2016,June 2, 2018, as filed with the SEC, without charge upon written request to the Secretary of the Company,company, Herman Miller, Inc., 855 East Main Street, P.O. Box 302, Zeeland, Michigan 49464-0302.
Proxy Statement Summary
This summary highlights information contained elsewhere in this proxy statement.Proxy Statement. This summary does not contain all of the information that you should consider, and you should read the entire proxy statement carefully before voting. For more complete information regarding the Company’scompany’s fiscal 20162018 performance, please review the Company’scompany’s Annual Report on Form 10-K for the year ended MayJune 2, 2018.
Proxy Statement Availability and Annual Meeting Information
This Proxy Statement and the accompanying Proxy, which we are making available to shareholders on or about August 28, 2016.2018, are furnished to the shareholders of Herman Miller, Inc. in connection with the solicitation by the Board of Directors of proxies to be used at the 2018 Annual Meeting of Shareholders. This meeting will be held on October 8, 2018, at 10:30 a.m. (ET). Please note that this year's Annual Meeting will once again be held via the Internet rather than in person.
We hold the Annual Meeting via the Internet due to the ease and convenience in attending, which is likely to increase participation levels. We also believe that holding the Annual Meeting via the Internet is beneficial to both shareholders and the company because it eliminates travel costs to shareholders and it eliminates costs to the company associated with holding an in-person meeting.
Voting Matters and Board Recommendations
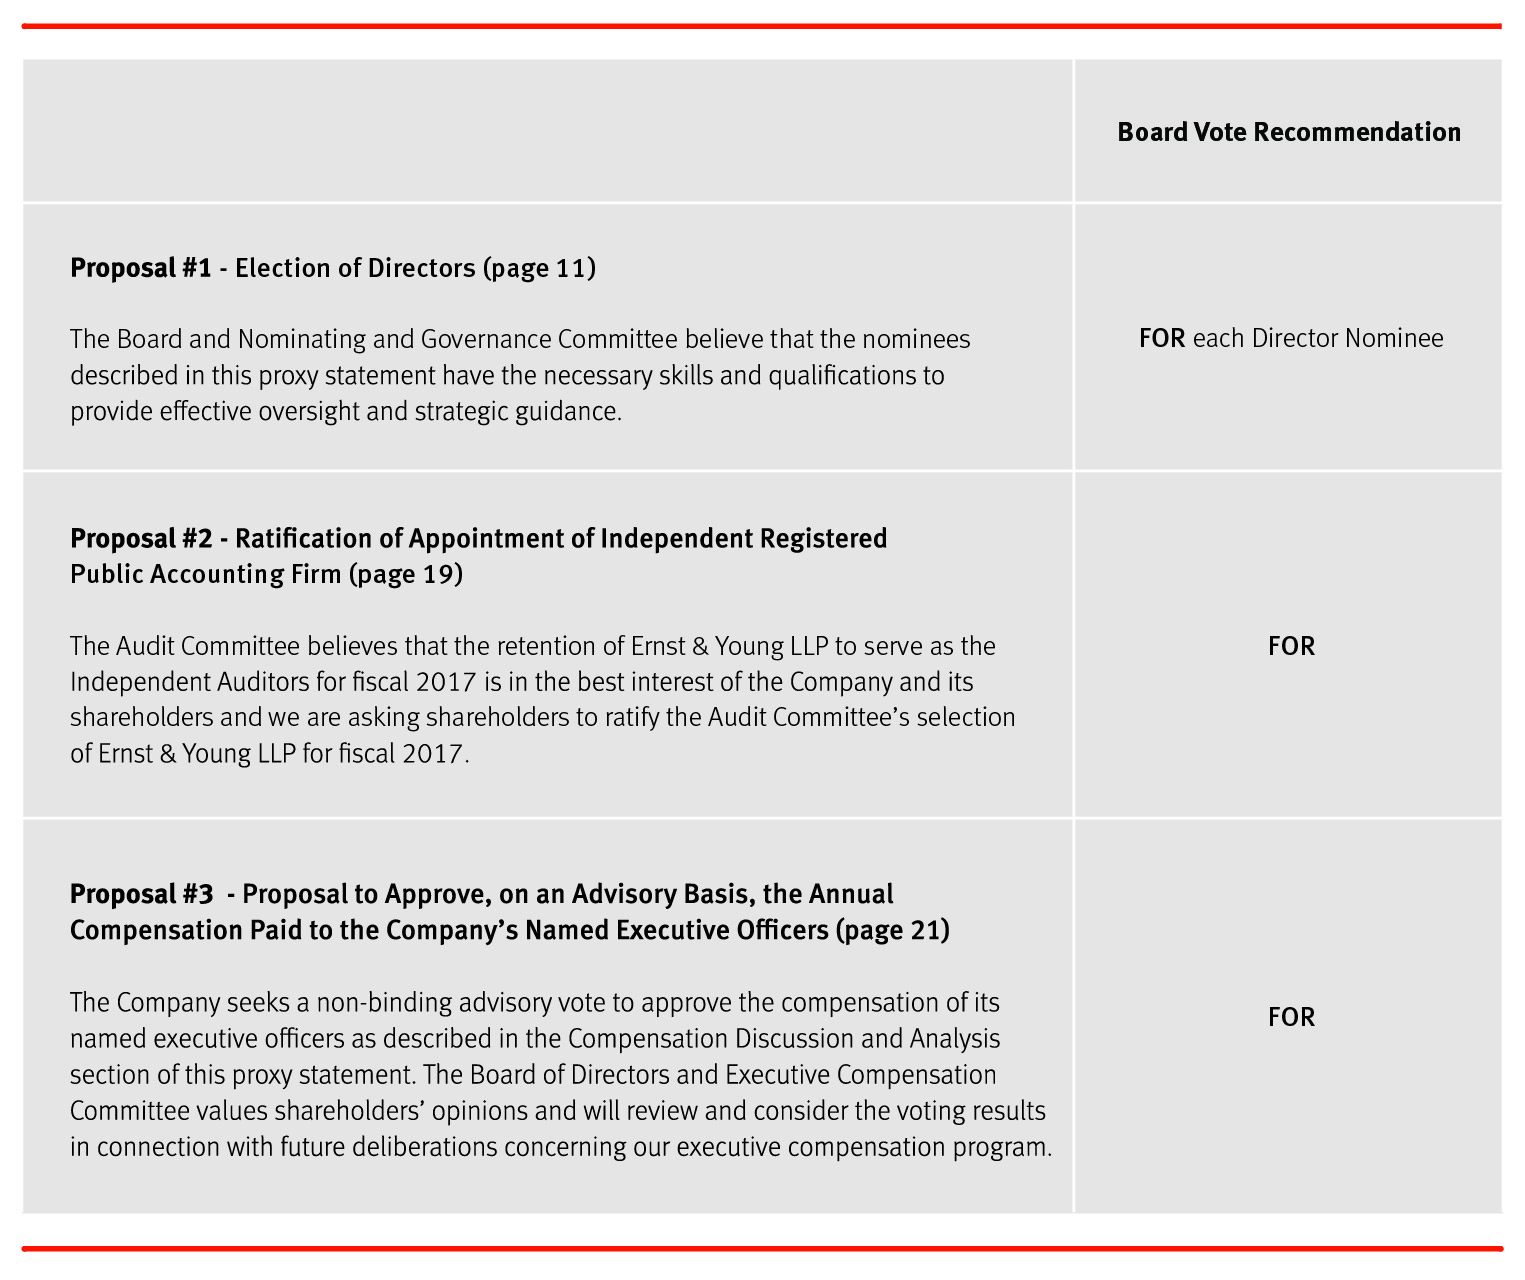
The Board is not aware of any matter that will be presented for a vote at the 20162018 Annual Meeting of Shareholders other than those shown below.
|
| |
| |
| Board Vote Recommendation |
| Proposal #1 - Election of Directors | FOR each Director Nominee |
| The Board and Nominating and Governance Committee believe that the nominees described in this Proxy Statement have the necessary skills and qualifications to provide effective oversight and strategic guidance. |
| Proposal #2 - Approval of Amendment to Articles of Incorporation | FOR |
| The Board has adopted, subject to shareholder approval, an amendment to our Articles of Incorporation that would allow us to amend our Bylaws to provide that, in an uncontested election, a nominee must receive a majority of the votes cast to be elected as a director. Under this proposal, in contested elections, where the number of nominees exceeds the number of directors to be elected, the voting standard would continue to be a plurality of the votes cast. |
| Proposal #3 - Ratification of Appointment of Independent Registered Public Accounting Firm | FOR |
| The Audit Committee believes that the retention of Ernst & Young LLP to serve as the Independent Auditors for fiscal 2019 is in the best interest of the company and its shareholders and we are asking shareholders to ratify the Audit Committee's selection of Ernst & Young LLP for fiscal 2019. |
| Proposal #4 - Proposal to Approve, on an Advisory Basis, the Annual Compensation Paid to the Company's Named Executive Officers | FOR |
| The company seeks a non-binding advisory vote to approve the compensation of its named executive officers as described in the Compensation Discussion and Analysis section of this Proxy Statement. The Board of Directors and Executive Compensation Committee value shareholders' opinions and will review and consider the voting results in connection with future deliberations concerning our executive compensation program. |
| |
Financial Highlights from Fiscal 20162018
Company Performance
Net sales increased in 20162018 to $2.26 billion,$2,381.2 million, an increase of 5.7%4.5% from the prior fiscal year and an all-timea record level of sales for the company. OrdersOn an organic basis, which adjusts for dealer divestitures, changes in foreign currency translation rates and the year were $2.28 billion, a year over year increaseimpact of 6.2%.the extra week in fiscal 2017, net sales increased by 6.5%(1) compared to last fiscal year. Each of our business segments delivered sales growth forover last year, led by double digit growth in the ELA and Consumer segments during the year.
While gross margins were impacted by higher commodity costs, unfavorable product mix and a competitive pricing environment compared to last year, operating expenses were well controlled during the year, despite facing foreign currency exchange headwinds. Strong gross margin performance coupled with effective expense management resulted in a 19% increase inand we continued to execute on our profit optimization efforts to help mitigate these factors. Consolidated diluted earnings per share of $2.12 and adjusted EPS diluted earnings per share of $2.30(1) increased compared to $2.17. We also delivered operatingprior year diluted earnings per share of $2.05 and adjusted diluted earnings per share of $2.16(1), respectively. Operating cash flowsflow generation of $210$167 million for the year enabled the company to fund capital expenditures supporting the business, repurchase $46 million of company shares and, subsequent to the end of the fiscal year, announce a 10% increase in the quarterly dividend to $0.1975 per share, the highest quarterly rate in Herman Miller's history.
Despite choppy industry order levels in the North America and an increaseuncertain political environment, the North America business segment delivered reported sales growth of 25% over0.6% and organic growth of 4.2%(1) compared to the prior fiscal year. A share repurchase program initiatedThe North America segment continued to deliver the highest operating margins of the company's business units. We made meaningful investments in design and innovation during the year, launching a full slate of new products and services aimed at delivering high performing solutions that meet our evolving customers’ needs.
The ELA segment recorded an increase in net sales of 12.7% for the year. After adjusting for the impact of changes in foreign currency and the impact of the extra week of operations in the 2prior fiscal year, organic net sales grew at a rate of 11.3%nd(1) quarter of fiscal 2016 andfor the recent announcementyear. The improvement in net sales reflected growth across each of our fifth dividend increasegeographic regions of EMEA, Asia-Pacific and Latin America. The ELA segment posted a decline in operating earnings of 1% relative to the past four years continues to enhance our returns to shareholders. These factors drove return on invested capital of approximately 22%prior year. However, after adjusting for the full fiscal year.impact of restructuring and other special charges, adjusted operating earnings improved by 14%(1).
Sales growth infor the North American businessSpecialty segment helped drive meaningful growth inwere 2.5% higher than prior year, as reported, and 3.9% higher than prior year on an organic basis(1). Operating earnings increased by 10% compared to the prior year, while adjusted operating earnings decreased by 45%(1). Lower profitability for the segmentNemschoff and was fairly broad based across industry sectors, with the notable exception of energy which continues to reflect that sector’s challenging economic backdrop. The Living Office framework, through new product launches, showroom re-sets, and training events during the year, reinforced our leadership in helping customers realize higher performing environments.
Our ELA business segment recorded strong organic sales growth (1) of 7%Maharam businesses for the year ledprimarily tied to lower demand levels and unfavorable product mix was partially offset by increases in China, India, Australia, Mexicooperating earnings growth for Geiger and the Middle East. A robust slate of new product launches and new manufacturing capability in India established nearHerman Miller Collection. We believe the beginning of the fiscal year positions us for further global growth.
Our Consumer segment reported sales growth of 7% over last year, although on an organic basis, segment sales were down 4% and profitability was lower than the prior fiscal year. Results were impacted by a net reduction in square footage from the beginning of the year from the closure of a number of smaller, legacy studios, lower studio revenues, pressure from actions taken to rationalize the wholesale channel, and investments in a new ERP system that provides important capabilities for the future. Design Within Reach remains well positioned to deliver long-term shareholder value through real estate transformation that is expected to increase selling square in larger format studios by nearly 100,000 square feet next year, planned launches of several exclusive product designs and a growing contract business - highlighting the potential that exists with our multi-channel strategy.
The Specialty segment posted growth in sales and profitability in fiscal 2016 across all of its businesses. The Specialty brands of Geiger, Maharam, Nemschoff and the Herman Miller Collection represent a powerful combination of inspiring brands that connect us to architect and design specifiers, expand our market opportunity in both traditional and ancillary workspaces, and serve as an increasingly important part of our economic engine.
Our Consumer segment reported strong momentum with net sales growth of 12.2% over last year, including four quarters of comparable brand(2) growth from Design Within Reach during the year and the addition of approximately 40,000 square feet of retail selling space. Growth was delivered from multiple channels this year, including studios, eCommerce, catalog and contract channels. Operating earnings and adjusted operating earnings increased by 190% and 157%(1), respectively. While the real estate expansion and investments to support long-term growth in the consumer business have limited near-term profitability over the past two years, the expansion of operating earnings this year, particularly in the second half of fiscal 2018, highlights the traction we are gaining as we scale the Consumer business.
(1) Non-GAAP measurements; see accompanying reconciliations and explanations on pg 55.
(2) DWR comparable brand sales reflects the year-over-year change in net sales across the multiple channels that DWR serves, including studios, outlets, contract, catalog, phone and e-commerce. Comparable brand growth was presented on a pro forma basis using a 52-week average to normalize results for the impact of an extra week of operations in the first quarter of fiscal 2017.
|
|
(1)Non-GAAP measurements; see accompanying reconciliations and explanations at page 54. |
Proposal #1 - Election of Directors
The Board of Directors of the Companycompany has nominated DorothyDavid A. Terrell, Lisa A. Kro, David O. UlrichBrandon, Douglas D. French, John R. Hoke III, and Michael A. VolkemaHeidi J. Manheimer for election as directors. Ms Terrell has been nominated to serve a one-year term until the 2017 annual meeting of shareholders; the other threeAll nominees would serve until the 20192021 annual meeting. As stated in our Bylaws, a person may not be elected as a director for a term that expires later than the annual meeting after attaining age 72. As such, Ms. Terrell, who is currently 71, is being nominated for a one year term only. Each of the nominees is now serving as a director and previously has been elected as a director by our shareholders, and the Board approved each of the nominees following the recommendation of our Nominating and Governance Committee.
We include more information about the nominees and the directors who will continue in office following the Annual Meeting below. Unless otherwise directed by a shareholder’s proxy, the persons named as proxy holders in the accompanying proxy will vote for the nominees named above. If any of the nominees becomes unavailable, which we do not anticipate, then the Board of Directors, at its discretion, may designate substitute nominees, in which event your proxy will be voted for such substituted nominees unless you have withheld authority to vote for directors. Shares cannot be voted for a greater number of people than the number of nominees named.
A plurality of the votes cast at the Annual Meeting is required to elect the nominees as our directors. Accordingly, the four individuals who receive the largest number of votes cast at the Annual Meeting will be elected as directors. Shares not voted at the Annual Meeting, whether by abstention, broker non-vote, or otherwise, will not be treated as votes cast at the Annual Meeting. In an election where the only nominees are those that the Board recommended, any director who receives a greater number of votes “withheld” than those “for” must tender his or her resignation under the majority voting provisions of our Board Governance Guidelines. Under those Guidelines, the Nominating and Corporate Governance Committee will consider the resignation and recommend to the Board whether to accept or reject the tendered resignation. The Board must act on the resignation no later than 90 days after certification of the shareholder vote at that meeting. The Companycompany will publicly disclose the Board’s decision whether to accept any resignation or the reasons for rejecting the resignation, if applicable.
Following this year’s Annual Meeting of shareholders, theThe Board of Directors will consistcurrently consists of twelveten directors, nine of which elevenwhom are independent. Mr. David O. Ulrich resigned from the Board effective December 8, 2017, and Mr. Brian C. Walker is scheduled to retire as President and Chief Executive Officer and from the Board, effective August 21, 2018. The maximum number of directors for the Board is thirteen. The Amended and Restated Bylaws of Herman Miller, Inc. require that directors be divided into three classes, each class to be as nearly equal in number as possible. Members of each class hold office until the third succeeding annual meeting following their election and until their successors are duly elected and qualified or until their removal or resignation except Ms. Terrell, who will hold office for only one year.resignation.
The Board of Directors recommends a vote FOR the election of each person nominated by the Board.
|
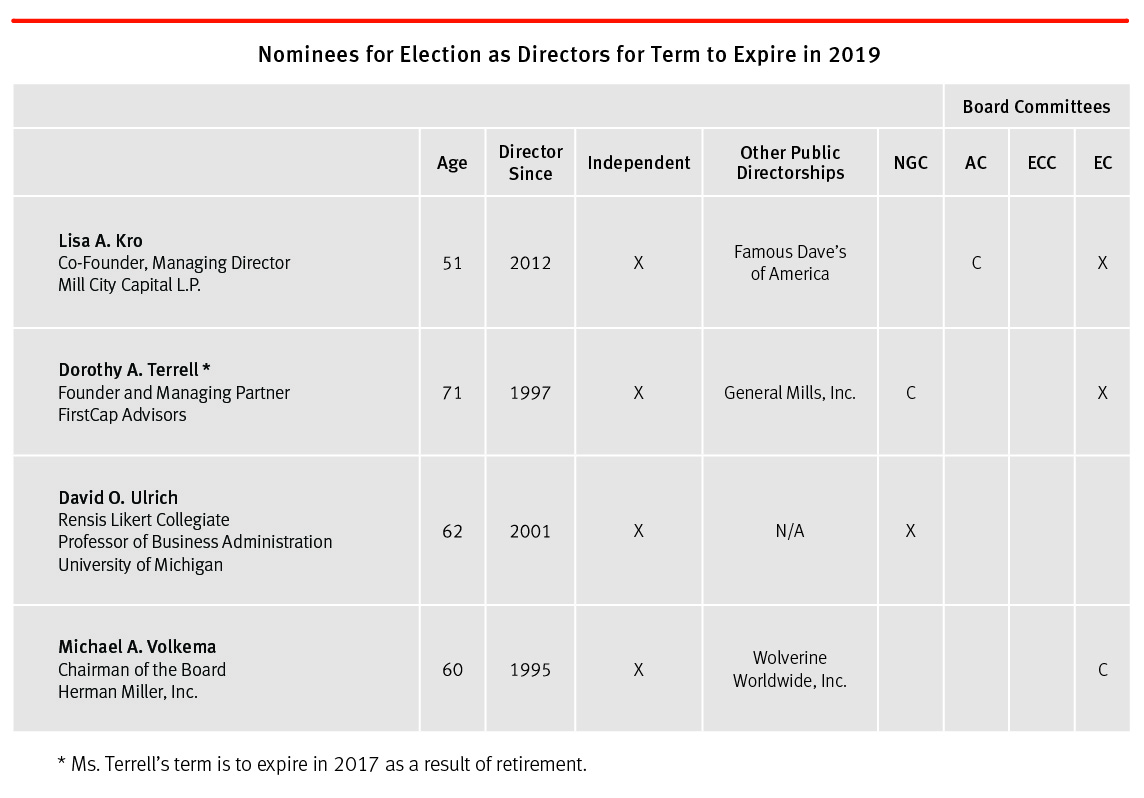
| | | | | | | | |
| Nominees for Election as Directors for Term to Expire in 2021 |
| | Board Committees |
| | Age | Director Since | Independent | Other Public Directorships (past 5 years) | NGC | AC | ECC | EC |
David A. Brandon Former Chairman and Chief Executive Officer Toys "R" Us, Inc. | 66 | 2011 | X | Domino's Pizza, Inc. DTE Energy Company Kaydon Corporation (formerly publicly traded) | | | X | |
Douglas D. French Managing Director Santé Health Ventures | 64 | 2002 | X | N/A | X | X | | |
John R. Hoke III Vice President Global Design Nike, Inc. | 53 | 2005 | X | N/A | | | X | |
Heidi J. Manheimer Executive Chairman of Surratt Cosmetics, LLC | 55 | 2014 | X | N/A | | X | | |
|
| | | | | | | | |
| Directors Whose Term Expires in 2019 |
| | Board Committees |
| | Age | Director Since | Independent | Other Public Directorships (past 5 years) | NGC | AC | ECC | EC |
Lisa A. Kro Co-Founder, Managing Director Mill City Capital L.P. | 53 | 2012 | X | Famous Dave's of America, Inc. | | C | | X |
Michael A. Volkema Chairman of the Board Herman Miller, Inc. | 62 | 1995 | X | Wolverine Worldwide, Inc. | | | | C |
|
| | | | | | | | |
| Directors Whose Term Expires in 2020 |
| | Board Committees |
| | Age | Director Since | Independent | Other Public Directorships (past 5 years) | NGC | AC | ECC | EC |
Mary Vermeer Andringa Chief Executive Officer and Board Chair Vermeer Corporation | 68 | 1999 | X | N/A | C | | | X |
Brenda Freeman Chief Marketing Officer Magic Leap | 54 | 2016 | X | Caleres Inc. Under Armour, Inc | X | | | |
J. Barry Griswell Retired, President and Chief Executive Officer Community Foundation of Greater Des Moines | 69 | 2004 | X | Voya Financial Inc. OZ Management | | | C | X |
Andrea Owen President and Chief Executive Officer Herman Miller, Inc. | 53 | 2018 | | Taylor Morrison Home Corporation | | | | |
| NGC: Nominating and Governance Committee AC: Audit Committee ECC: Executive Compensation Committee EC: Executive Committee C: Chair X: Member | | | | | | | | |
Information about the Nominees and Directors
Certain information with respect to the nominees for election at Annual Meeting, as well as each of the other Directors, is set forth below and on the following pages, including their names, ages, a brief description of their recent business experience, including present occupations and employment, certain directorships that each person held during the last five years, and the year in which each person became a Director of the Company. Additionalcompany. We also include additional information below and on the following pages about each continuing Director is also included that describesdescribing some of the specific experiences, qualifications, attributes or skills that each Director possesses which the Board believes has prepared them to be effective Directors.
|
| | | | |
Nominees for Election as Directors for Term to Expire in 20192021 |
| Name and Age | Year First Became a Director | Principal Occupation(s) During Past 5 years | Other Directorships of Public Companies held during Past 5 years |
| | | |
Lisa A. Kro, 51 | 2012 | Co-Founder, Managing Director | Famous Dave's of America |
| | Mill City Capital L.P. since 2010 | |
| | Managing Director and CFO, Goldner Hawn Johnson & Morrison | |
| | 2004 to 2010 | |
| | | |
Ms. Kro is a founding partner of Mill City Capital, L.P., a private equity firm, where she is Managing Director. From 2004 to 2010, Ms. Kro was the Chief Financial Officer and a Managing Director of Goldner Hawn Johnson & Morrison, also a private equity firm. Prior to joining Goldner Hawn, she was a partner at KPMG LLP, an international public accounting firm.
Ms. Kro's service in auditing as well as her experience in the finance and capital environments enable her to contribute to a number of financial and strategic areas of the Company. Her experience on other boards, including previous service as the financial expert on the audit committee of another publicly-traded company, contributes to the oversight of the Company's financial accounting controls and reporting; accordingly, the Board recommended her nomination for re-election as a director.
|
| | | |
| | | |
Dorothy A. Terrell, 71 | 1997 | Founder and Managing Partner, FirstCap Advisors | General Mills, Inc. |
| | since 2010 | |
| | Venture Partner, First Light Capital | |
| | from 2003 to 2010 | |
| | | |
Ms. Terrell is the Founder and Managing Partner of FirstCap Advisors, a venture capital and advisory firm committed to helping innovative technology companies move successfully through the critical early stages of product and business development. Prior to this she was a Partner at First Light Capital, a venture capital fund investing in early stage products and service companies in enterprise software and integration, communications and business-to-business e-commerce. Concurrent with her service to First Light Capital, she was President and CEO of the Initiative for a Competitive Inner City, a national not-for-profit organization. Ms. Terrell has over twenty-five years of experience in the technology industry. At NMS Communications she was Senior Vice President of Worldwide Sales and concurrently President of Platforms & Services Group. She was also a Corporate Officer at Sun Microsystems, Inc. and President of its subsidiary, SunExpress.
Ms. Terrell's experience as a senior executive, her knowledge and service in the technology arena and service to other boards led the Board of Directors to recommend that she continue to serve as a director.
|
| | | |
| | | |
David O. Ulrich, 62 | 2001 | Professor, University of Michigan since 1982 | None |
| | | |
Dr. Ulrich is the Rensis Likert Collegiate Professor of Business Administration at the University of Michigan. He also provides counsel to more than half of the Fortune 200 companies, focusing on strategic management and competitive advantage issues as well as human resource management, leadership culture and talent. He has published thirty books and hundreds of articles on these and related topics.
Dr. Ulrich's academic research and consulting on strategic management and other business issues, among other factors, contributed to the recommendation by the Board of Directors that his service continue as a director.
|
|
| | | |
| | | |
Michael A. Volkema, 60 | 1995 | Chairman of the Board, Herman Miller, Inc. | Wolverine Worldwide, Inc. |
| | since 2000 | |
| | | |
Mr. Volkema has been Chairman of the Board of Directors of Herman Miller, Inc. since 2000. He also served as CEO and President of the Company from 1995 to 2004. Mr. Volkema has more than thirty years of experience as a senior executive in the home and office furnishings industry. This experience includes corporate leadership, branded marketing, international operations, and public company finance and accounting through audit committee service.
Mr. Volkema is a key contributor to the Board based upon his knowledge of the Company's history and culture, operational experience, board governance knowledge, service on boards of other publicly held companies and industry experience. These factors contributed to his recommendation by the Board for continued service as a director. |
| | | |
|
| | | |
Directors Whose Terms Expire in 2017 |
Name and Age | Year First
Became
a Director
| Principal Occupation(s) During Past 5 years | Other Directorships of Public Companies
held during Past 5 years
|
| | | |
Mary Vermeer Andringa, 66 | 1999 | Chair of the Board | None |
| | Vermeer Corporation since November 2015 | |
| | Chief Executive Officer and Chair of the Board | |
| | Vermeer Corporation from November 2014 to October 2015 | |
| | President and Chief Executive Officer | |
| | Vermeer Corporation from 2003 to October 2014 | |
| | | |
Since 1989, Ms. Andringa has been an executive officer of Vermeer Corporation, a leading manufacturer of agricultural, construction, environmental and industrial equipment located in Pella, Iowa. She served as President and Chief Executive Officer of Vermeer from 2003 to November 2014. At that time she became Chief Executive Officer and Chair of the Board. She transitioned exclusively to Chair of the Board in November 2015. Ms. Andringa's tenure with Vermeer has spanned the gamut of functional expertise from marketing to international sales and acquisitions. With over thirty years of manufacturing experience, Ms. Andringa is past Chair of the National Association of Manufacturers which represents over 10,000 U.S.-based manufacturing entities.
Ms. Andringa's experience as a chief executive officer coupled with her focused efforts on lean manufacturing and continuous improvement initiatives as well as her involvement in international product sales and distribution provides an important resource to management and the Board of Directors.
|
| | | |
| | | |
Brenda Freeman, 47 | 2016 | Chief Marketing Officer, National Geographic Channel | Under Armour, Inc. |
| | since February 2015 | |
| | Global Head of Television Marketing, DreamWorks Animation SKG | |
| | April 2014 to February 2015 | |
| | Chief Marketing Officer, Turner Animation | |
| | 2008 to April 2014 | |
| | | |
Ms. Freeman is the Chief Marketing Officer for National Geographic Channel and Nat Geo Wild. Previously, Ms. Freeman was Global Head of Television Marketing for DreamWorks Animation. Prior to DreamWorks Animation, Ms. Freeman spent six years at Turner Broadcasting, most recently as Chief Marketing Officer for Turner Animation, Young Adults and Kids Media. Before that she served as SVP of Integrated Marketing and Promotions for the Nickelodeon MTVN Kids and Family Group. She was appointed to the Board of Directors of Herman Miller, Inc. in January 2016.
Ms.Freeman's experience as marketing executive and her specific experience with the digital marking and programming brings significant strength to the Board in advising management as it develops and executes the company’s brand and demand pull marketing strategies.
|
| | | |
| | | |
J. Barry Griswell, 67 | 2004 | President and CEO, Community Foundation of Greater | Och-Ziff Capital Management |
| | Des Moines 2008 to 2013 | Group LLC |
| | | Voya Financial Inc. |
| | | National Financial Partners Corp. |
| | | |
Mr. Griswell is the retired Chairman and Chief Executive Officer of the Principal Financial Group and Principal Life, a global financial services provider which offers a wide range of insurance and financial products and services. With more than thirty years of financial services experience, Mr. Griswell was the President and CEO of MetLife Marketing Corporation prior to joining The Principal. He is a former director and non-executive chairman of the board of the Principal Financial Group. Mr. Griswell is currently a director of Och-Ziff Capital Management Group where he serves as the chair of the Executive Compensation Committee, and is a member of the Audit Committee and the Nominating and Governance Committee. He also is a director of Voya Financial where he serves on the Audit Committee and the Nominating and Governance Committee and as chair of the Executive Compensation and Benefits Committee.
Mr. Griswell's financial expertise, governance experience and service as an executive of a publicly-traded corporation make him a key contributor to the Board of Directors.
|
|
| | | |
| | | |
Brian C. Walker, 54 | 2003 | President and Chief Executive Officer | Briggs & Stratton Corporation |
| | Herman Miller, Inc. since 2004 | Universal Forest Products |
| | | |
Since 2004, Mr. Walker has served as President and Chief Executive Officer of the Company. Previously, he held other executive leadership positions with the Company having served as the Chief Operating Officer of Herman Miller Inc., President of Herman Miller North America and Chief Financial Officer. Mr. Walker is a Certified Public Accountant and serves as the lead director and chairs the Compensation Committee of Briggs & Stratton Corporation.
Mr. Walker is the only member of Company management on the Board of Directors, which provides an important link to the Company's ongoing business operations and challenges. Moreover, Mr. Walker's knowledge of the Company's history and culture, operational and executive leadership roles with the Company, accounting acumen and governance experience make him an important contributor to the Board's deliberations.
|
| | | |
|
| | | | |
Directors Whose Terms Expire in 2018 |
Name and Age | Year First
Became
a Director
| Principal Occupation(s) During Past 5 years | Other Directorships of Public Companies
held during Past 5 years
|
| | | |
David A. Brandon, 6466 | 2011 | Chairman and CEO, Toys "R" Us, Inc. | Domino's Pizza, Inc. |
| | | since July 2015 to 2018 | DTE Energy Company |
| | | Director of Intercollegiate Athletics, University of Michigan | Kaydon Corporation |
| | | 2010 to October 2014 | (formerly publicly traded) |
| | | | |
Mr. Brandon is the former Chairman and Chief Executive Officer of Toys "R" Us, Inc., a retailer of toys and juvenile products. Mr. Brandon joined Toys "R" Us in 2015 and officially left the company in May 2018. On September 18, 2017, Toys "R" Us filed a voluntary petition for relief under the United States Bankruptcy Code in the United States Bankruptcy Court for the Eastern District of Virginia (Richmond Division). Mr. Brandon served as the Director of Intercollegiate Athletics at the University of Michigan from 2010 to October 2014. Prior to that, he served as Chairman and Chief Executive Officer of Domino's Pizza, Inc., an international pizza delivery company operating over 9,000 stores in over 60 countries. Mr. Brandon was also President and Chief Executive Officer of Valassis, Inc. from 1989 to 1998 and Chairman of its Board of Directors from 1997 to 1998. Mr. Brandon's years of experience as a Chief Executive Officerchief executive officer of several publicly-traded companies, his experience in global brand management and his for-profit and non-profit board service bring a unique perspective to the Board of Directors. These factors contributed to his recommendation by the Board for continued service as a director. |
|
| | | | |
Douglas D. French, 6264 | 2002 | Managing Director, Santé Health Ventures | None |
| | | since 2007 | |
| | | | |
Mr. French has served as the founding partner of Santé Health Ventures, an early-stage healthcare venture fund, since 2007. Prior to joining Santé Health Ventures, he served as the President and Chief Executive Officer of Ascension Health, the largest not-for-profit health system in the U.S. Mr. French has also served as CEO for St. Mary's Medical Center and St. Vincent Health System, both of midwestMidwest Indiana. He has more than three decades of health management experience including serving as a director for numerous public and private companies. Mr. French's governance experience, as well as his leadership roles and expertise in the health management industry, provides a valuable resource to management and the Board of Directors.Directors; accordingly, the Board recommended his nomination for re-election as a director. |
| | | |
| | | |
John R. Hoke III, 5153 | 2005 | Vice President,Chief Design Officer, Nike, Global Design,Inc. | None |
| | | since 2017 | |
| | Vice President, Nike Global Design 2010 to 2017 | |
| | | | |
Since joining Nike, Inc., a marketer of athletic footwear, apparel, equipment, accessories and services, in 1993, Mr. Hoke has led the communication of Nike's culture of creativity internally and externally. He is currently the Chief Design Officer of Nike, Inc. having previously served as Vice President of Global Design, inspiring and overseeing an international team of designers. Mr. Hoke also serves as a director to several not-for-profit organizations relating to art and design. Mr. Hoke's design expertise, both domestically and internationally, including his leadership role in a major, global enterprise, brings additional, insightful perspective to our Board discussions and decisions.decisions, and contributed to his recommendation by the Board for continued service as a director. |
| Heidi J. Manheimer, 55 | 2014 | Executive Chairman, Surratt Cosmetics LLC | None |
| | since December 2017 | |
| | | | |
Heidi J. Manheimer, 53 | 2014 | Independent Consultant since October 2015 to 2017 | None |
| | | Chief Executive Officer, Shiseido Cosmetics America | |
| | | | from 2006 to September 2015 | |
| | | | |
Ms. Manheimer is the Executive Chairman of Surratt Cosmetics LLC, a customizable beauty products and cosmetics company. Ms. Manheimer served as the Chief Executive Officer of Shiseido Cosmetics America, a global leader in skincare and cosmetics, from January 2006 to September 2015, as President of U.S. Operations from 2002 to 2006 and as Executive Vice President and General Manager from 2000 to 2002. Prior to that she spent seven years at Barney's New York and seven years at Bloomingdales in the beauty care divisions, rising to senior leadership positions within each company. Ms. Manheimer currently sits on the Board of Directors of Burton Snowboards having been appointed in 2006. For many years, she has served on nonprofit and trade association boards, and she was elected Chairwoman of the Cosmetic Executive Women Foundation in 2014.
Ms. Manheimer’s extensive experience as a senior executive in the retail industry, experience with both e-commerce and international business practices and service as a board member for both profit and nonprofit businesses ledprovide a valuable resource to management and the Board of Directors, accordingly, the Board recommended her nomination for re-election as a director. |
|
| | | |
| Directors Whose Terms Expire in 2019 |
| Name and Age | Year First Became a Director | Principal Occupation(s) During Past 5 years | Other Directorships of Public Companies held during Past 5 years |
| | | |
| Lisa A. Kro, 53 | 2012 | Co-Founder, Managing Director | Famous Dave's of America, Inc. |
| | Mill City Capital L.P. since 2010 | |
| | | |
Ms. Kro is a founding partner of Mill City Capital, L.P., a private equity firm, where she is Managing Director. From 2004 to 2010, Ms. Kro was the Chief Financial Officer and a Managing Director of Goldner Hawn Johnson & Morrison, also a private equity firm. Prior to joining Goldner Hawn, she was a partner at KPMG LLP, an international public accounting firm.
Ms. Kro's service in auditing as well as her experience in the finance and capital environments enable her to contribute to a number of financial and strategic areas of the company. Her experience on other boards, including previous service as the financial expert on the audit committee of another publicly-traded company, contributes to the oversight of the company's financial accounting controls and reporting. |
|
| | | |
| | | |
| Michael A. Volkema, 62 | 1995 | Chairman of the Board, Herman Miller, Inc. | Wolverine Worldwide, Inc. |
| | since 2000 | |
| | | |
Mr. Volkema has been Chairman of the Board of Directors of Herman Miller, Inc. since 2000, serving as non-executive Chairman since 2004. He also served as CEO and President of the company from 1995 to 2004. Mr. Volkema has more than thirty years of experience as a senior executive in the home and office furnishings industry. This experience includes corporate leadership, branded marketing, international operations, and public company finance and accounting through audit committee service.
Mr. Volkema is a key contributor to the Board based upon his knowledge of the company's history and culture, operational experience, board governance knowledge, service on boards of other publicly held companies and industry experience. |
| | | |
|
| | | |
| Directors Whose Terms Expire in 2020 |
| Name and Age | Year First Became a Director | Principal Occupation(s) During Past 5 years | Other Directorships of Public Companies held during Past 5 years |
| Mary Vermeer Andringa, 68 | 1999 | Chair of the Board | None |
| | Vermeer Corporation since 2015 | |
| | Chief Executive Officer and Chair of the Board | |
| | Vermeer Corporation from 2014 to 2015 | |
| | President and Chief Executive Officer | |
| | Vermeer Corporation from 2003 to 2014 | |
| | | |
Since 1989, Ms. Andringa has been an executive officer of Vermeer Corporation, a leading manufacturer of agricultural, construction, environmental and industrial equipment located in Pella, Iowa. She served as President and Chief Executive Officer of Vermeer from 2003 to 2014. At that time, she became Chief Executive Officer and Chair of the Board. She transitioned exclusively to Chair of the Board in 2015. Ms. Andringa's tenure with Vermeer has spanned the gamut of functional expertise from marketing to international sales and acquisitions. With over thirty years of manufacturing experience, Ms. Andringa is past Chair of the National Association of Manufacturers which represents over 14,000 U.S.-based manufacturing entities. Ms. Andringa has served the last four years as the co-chair for the B20 Task Force for Small and Medium Enterprises. The B20 is a group of business leaders from the G20 countries who develop and advise the political leaders for the G20 on proposals to improve global growth. Ms. Andringa's experience as a chief executive officer coupled with her focused efforts on lean manufacturing and continuous improvement initiatives as well as her involvement in international product sales and distribution provide an important resource to management and the Board of Directors. |
|
| | | |
Directors Whose Terms Expire in 2020 (continued) |
| Name and Age | Year First Became a Director | Principal Occupation(s) During Past 5 years | Other Directorships of Public Companies held during Past 5 years |
| Brenda Freeman, 54 | 2016 | Chief Marketing Officer, Magic Leap since 2017 | Caleres, Inc. |
| | Chief Marketing Officer, National Geographic Channel | Under Armour, Inc. |
| | 2015 to 2017 | |
| | Global Head of Television Marketing, DreamWorks Animation SKG | |
| | 2014 to 2015 | |
| | Chief Marketing Officer, Turner Animation | |
| | 2008 to 2014 | |
Ms. Brenda Freeman is the Chief Marketing Officer for Magic Leap, a technology company that is developing a mixed reality computing platform that is on the cutting edge of the virtual and augmented reality world of wearable technology. She is responsible for all aspects of brand and product marketing, including the customer journey experience - CRM, social, digital, publicity, experiential and influencer marketing. Prior to her current role, Freeman was Chief Marketing Officer for the National Geographic Channels, a naturalist cable television production platform, where she oversaw brand development, multi-platform creative architecture and consumer communication. She was also global head of television marketing for DreamWorks, a television and movie production and distribution company, Chief Marketing Officer of Cartoon Network at Turner Broadcasting and Senior Vice President for Nickelodeon integrated marketing and partnerships at Viacom. Early in her career, she held consumer marketing and product development positions for Frito-Lay and Pepsi-Cola, both divisions of PepsiCo.
Ms. Freeman's experience as marketing executive and her specific experience with digital marketing and programming brings significant strength to the Board in advising management as it develops and executes the company’s brand and demand pull marketing strategies. |
| J. Barry Griswell, 69 | 2004 | Retired President and CEO, Community Foundation of Greater | Voya Financial Inc. |
| | Des Moines 2008 to 2013 | OZ Management |
| | | |
Mr. Griswell is the retired chairman and chief executive officer of the Principal Financial Group and Principal Life, a global financial services provider which offers a wide range of insurance and financial products and services. With more than thirty years of financial services experience, Mr. Griswell was the president and CEO of MetLife Marketing Corporation prior to joining The Principal. He is a former director and non-executive chairman of the board of the Principal Financial Group. Mr. Griswell is a director of Voya Financial, where he serves on the Executive Committee and as chair of the Risk, Investment and Finance Committee. Mr. Griswell's financial expertise, governance experience and service as an executive of a publicly-traded corporation make him a key contributor to the Board of Directors. |
| Andrea Owen, 53 | 2018 | President and Chief Executive Officer | Taylor Morrison Home Corporation |
| | Herman Miller, Inc. since 2018 | |
| | Global President, Banana Republic 2014 to 2017 | |
| | Executive Vice President GAP Global Outlet | |
| | 2010 to 2014 | |
| | | |
Ms. Owen has been elected by the Board of Directors to appointsucceed Brian C. Walker as the company’s next President and Chief Executive Officer, effective August 22, 2018. Ms. Owen was also elected to the company’s Board of Directors as of August 22. She joins Herman Miller after a 25-year career at Gap Inc., where she most recently served as Global President of Banana Republic, leading 11,000 employees in over 600 stores across 27 countries. She has developed a diversified skillset that aligns with the strategic direction of Herman Miller today and ranges from digital and omni-channel transformation to design, development and supply chain management, making her as a director in fiscal year 2014.an important contributor to the Board. |
The Nominating and Governance Committee has not received any nominations from any of our shareholders in connection with our 20162018 Annual Meeting. The nominees who are standing for election as directors at the 20162018 Annual Meeting are incumbent directors.
Corporate Governance and Board Matters
Board Governance Guidelines
Our Board of Directors is committed to sound and effective corporate governance practices, strong oversight of corporate risk management, ethical conduct and compensation. These practices reflect the Board's long-standing philosophy that a proper structure, appropriate policies and procedures, and reflective cultural factors provide the cornerstone to good governance. The Board documented those practices by adopting our Board Governance Guidelines ("Guidelines"). These Guidelines address director responsibilities, the composition of the Board, required Board meetings and materials, Board committee composition and responsibilities, and other corporate governance matters. Under our Guidelines, a majority of the members of our Board must qualify as independent under the listing standards of the NASDAQ National Markets requirements.Markets. Our Guidelines also require the Board to have, among other committees, an Audit Committee, an Executive Compensation Committee, and a Nominating and Governance Committee, and that each member of those committees qualifies as an independent director under the NASDAQ listing standards. Our Guidelines, as well as the charters of each of the foregoing committees, are available for review on our website at www.hermanmiller.com/governance.
The Guidelines, with respect to the position of Chief Executive Officer (“CEO”) and Chairperson, state that “the Board believes the roles of CEO and Chairperson should normally be separated. If the positions are combined, the Board will closely monitor the performance and working relationship between the CEO/Chairperson and the Board and will establish a Lead Director who actsto act as a liaison between directors and the CEO/ChairmanChairperson and who chairs meetings of the independent directors.” Consistent with our Guidelines, the roles of CEO and Chairperson are currently separate. Mr. Volkema currently serves as Chairman of the Board. As Mr. Volkema is not an employee of the company, he serves as a non-executive Chairman.
The Board's Role in Risk Oversight
The Company'scompany's management annually engages in an enterprise risk management process, the key output of which is a series of risk matrices intended to identify and categorize strategic risks. The matrices also identify (1) those members of senior management who are responsible for monitoring each major risk, and (2) whether that risk is reviewed by the Board or a committee of the Board. The development of the matrices is facilitated by the Company'scompany's Business Risk Group, through discussions with executive and senior management. Management and the Business Risk Group annually review and discuss the risk assessment process and results with the Audit Committee and, if applicable, recommend what risks are being adequately addressed, directly or indirectly, on a regular basis and what risks should be further discussed with the full Board or other committees and the appropriate form and timing of such discussions. The Business Risk Group is the internal audit group of the company.
During the past fiscal year, the Business Risk Group reviewed the Company'scompany's compensation policies and practices to determine if those policies or practices are reasonably likely to have a material adverse impact on the Company.company. The Business Risk Group conducted its review in late 20152017 and provided a report to the Committee in January 2016.2018. In conducting its review of the compensationscompensation plans, the Committee considered both the structure of the compensation plans and the presence of risk mitigating features such as caps, multi-year earning requirements, vesting provisions and “clawbacks.” Based on the evaluation, the Committee determinedconcurs with management's determination that the Company'scompany's compensation policies and practices are not reasonably likely to create a material adverse impact on the Company.company.
Under the Guidelines, the Board of Directors is responsible for evaluating CEO performance, monitoring succession planning, reviewing the Company'scompany's major financial objectives, evaluating whether the business is being properly managed and overseeing the processes for maintaining the integrity of the Companycompany with respect to its financial statements, public disclosures and compliance with laws. The Board has delegated the primary oversight for managing the risk with respect to some of these to the various board committees as described in the committee charters.
Code of Conduct
Our Board has adopted a Code of Conduct that applies to all of our employees, officers, and directors. This code also serves as the code of ethics for our CEO and senior financial officers. This code is posted on our website at http://www.hermanmiller.com/about-us/who-is-herman-miller/legal/corporate-code-of-conduct.html. Any changes to or waivers of the code must be approved by the Board of Directors and will be disclosed on the Company'scompany's website. The Code of Conduct was last modified in December 2009.2015. The Code of Conduct is reviewed annually and there were no modifications to or waivers of the code in fiscal 2016.2018. The Code of Conduct meets the requirements of the NASDAQ listing standards.
Determination of Independence of Board Members
As required by our Guidelines, our Board has determined that each of our directors, other than Mr. Walker,Ms. Owen (effective August 22, 2018), qualifies as an “Independent Director,” as such term is defined in the NASDAQ listing standards, and that none of those independent directors has a material relationship with the Company.company. The Board's determination was made as a result of its review of completed individual questionnaires addressing the nature and extent of each member's relationship with the Companycompany and taking into consideration the definition of “Independent Director” under the NASDAQ rules. Our Board also determined that each member of the Audit Committee and Executive Compensation Committee meets the independence requirements applicable to those committees as prescribed by the NASDAQ listing standards and, as to the Audit Committee, the applicable rules of the Securities and Exchange Commission.SEC.
Corporate Governance and Board Matters (continued)
Meeting Attendance
Each of our directors is expected to attend all meetings of the Board and applicable committee meetings. We hold the Annual Meeting via the Internet,meetings, and the directorsDirectors are encouraged to join the webcast.webcast for the Annual Meeting. All eleven of our then current directors did so for our 20152017 Annual Shareholders Meeting.Meeting, including Ms. Dorothy Terrell, Mr. David O. Ulrich, and Mr. Brian C. Walker, who ceased to be directors subsequent to the meeting. During fiscal 2016,2018, the Board held fourseven meetings; each director attended at least 75 percent of the aggregate number of meetings of our Board and Board committeesCommittees on which they served. Consistent with the requirements of our Guidelines, the independent members of our Board met in executive sessions, without the presence of management, at the conclusion of each regularly scheduled Board meeting.
Communications with the Board
Shareholders and other parties interested in communicating directly with one or more of our directors may do so by writing to us, c/o Corporate Secretary, 855 East Main Avenue, PO Box 302, Zeeland, Michigan 49464-0302. The Corporate Secretary will forward all relevant correspondence to the director or directors to whom the communication is directed.
Director Nominations
Our Bylaws contain certain procedural requirements applicable to shareholder nominations of directors. Shareholders may nominate a person to serve as a director if they provide written notice to us not earlier than the close of business on the 120th day and not later than the close of business on the 90th day prior to the first anniversary of the preceding year's Annual Meeting of Shareholders and, with respect to any special meeting of shareholders, not later than the close of business on the 10th day following the date on which the meeting is first publicly announced or, if there is no announcement, the 10th day following the date on which the notice of that meeting was first sent to our shareholders. The notice must include (1) the name and address of the shareholder providing notice and of the person or persons nominated, including information on the securities of the Companycompany held by those individuals, including any derivative securities, the details of which are set forth in our Bylaws, (2) a representation that the shareholder is a current record holder and will continue to hold those shares through the date of the meeting and intends to attend the meeting in person or by proxy, (3) for each proposed nominee, (a) all information relating to that person that would be required to be disclosed in a proxy statementProxy Statement required to be made in connection with solicitations or proxies for election of directors in a contested election pursuant to Section 14 of the Securities and Exchange Act of 1934 (including that person's written consent to be named in the proxy statementProxy Statement as a nominee and to serve as a director if elected) and (b) a description of all direct and indirect compensation and other material monetary arrangements existing during the past three years, as well as any other material relationships between or among the shareholders (and beneficial owner, if any) and their respective affiliates and associates and the proposed nominee and his or her respective affiliates and associates, including all information required to be disclosed pursuant to Rule 404 under Regulation S-K, and (4) the completed and signed questionnaire from each nominee with respect to the background and qualification of such person and the background of any other person or entity on whose behalf the nomination is being made.
Our Nominating and Governance Committee is responsible for reviewing the qualifications and independence of the members of the Board. To meet the needs of the Companycompany in a rapidly changing environment, the Guidelines explain that the Companycompany requires a high-performance board of directors whose members subscribe to our values and meet the specific resource needs of the business. To that end, the Nominating and Governance Committee considers a number of factors it deems appropriate when considering candidates for the Board; such factors may include experience and knowledge of the Company'scompany's history and culture, technical experience and backgrounds such as manufacturing, design, marketing, technology, finance, management structure and philosophy, and experience as a senior executive of a public company.company, and diversity. The Nominating and Governance Committee may also consider such factors as race and gender as well as experience in a variety of industries in annually assessing and reviewing the current slate of directors and potential director candidates as the need arises. The Nominating and Governance Committee is responsible for assessing the appropriate skills and characteristics required of Board members. These factors, and others as considered useful by the Nominating and Governance Committee or the Board, are reviewed in the context of an assessment of the perceived needs of the Board at a particular point in time.
A shareholder may also make a recommendation to the Nominating and Governance Committee regarding any individual that the shareholder desires the Committee to consider for possible nomination as a candidate for election to the Board. The Board believes that all candidates, including those that shareholders recommend, should be evaluated in the same manner.
Under our Bylaws and Governance Guidelines, no person is to be elected as a director: (a) after he or she attains age 72 or (b) for a term that expires later than the annual meeting of shareholders at or immediately after such person attains age 72.
Board Committees
Our Board has four standing committees. Committee responsibilities are detailed in written charters. These charters are available on our Internet website at www.hermanmiller.com/charters. The committees are as follows:
Nominating and Governance Committee
We have a Nominating and Governance Committee comprised of Dorothy A. TerrellMary Vermeer Andringa (chair), Mary V. AndringaBrenda Freeman and David O. Ulrich.Douglas French. The Nominating and Governance Committee develops and recommends to the Board governance standards and policies and board compensation including that of the Chairman of the Board. In addition, the committee identifies and recommends to the Board candidates for election to the Board. The Committee met fivefour times during the last fiscal year.
Audit Committee
We have an Audit Committee comprised of Lisa A. Kro (chair), Douglas D. French and Heidi J. Manheimer. The Board has determined that Ms. Kro is qualified as an “Audit Committee“audit committee financial expert” within the meaning of the applicable SEC regulations. This committee, composed entirely of independent directors under the applicable listing standards of the NASDAQ listing requirements, as well as the requirements of the Sarbanes-Oxley Act of 2002, is responsible for overseeing management's reporting practices, internal controls, and risk management on behalf of the Board of Directors. The Committeecommittee is also responsible for appointing, approving the compensation of, and overseeing our independent registered public accounting firm. The Audit Committee met eight times during the last fiscal year.
Executive Compensation Committee
We have an Executive Compensation Committee comprised of J. Barry Griswell (chair), David A. Brandon and John R. Hoke III. The Executive Compensation Committee recommends to the Board the annual executive incentive plan and the annual remuneration of our Chief Executive Officer and President, approves the annual remuneration and executive incentive plan for the other executive officers, approves the grants of employee stock options and other equity awards, and acts as the administrative committee for our equity-based compensation plans. A description of the Committee'scommittee's processes and procedures for the consideration and determination of executive and director compensation is set forth under the caption “Compensation DisclosureDiscussion and Analysis -The- Executive Compensation Committee”Summary” below in this Proxy Statement. The Committeecommittee met four times during the last fiscal year.
Executive Committee
We have an Executive Committee comprised of Michael A. Volkema (chair), Mary Vermeer Andringa, J. Barry Griswell and Lisa A. Kro and Dorothy A. Terrell.Kro. The Executive Committee acts from time to time on behalf of the Board in managing our business and affairs (except as limited by law or our Bylaws) and is delegated certain assignments and functions by the Board of Directors. The Committeecommittee met four times during the last fiscal year.
Executive Compensation Committee Interlocks and Insider Participation
No member of the Executive Compensation Committee is or has been an officer or employee of the Companycompany or had any relationship that is required to be disclosed as a transaction with a related party except as noted under Certain Relationships and Related Party Transactions. In addition, no current executive officer of the Companycompany has ever served as a member of the Board of Directors or Compensation Committeecompensation committee of any other entity that has or has had one or more executive officers serving as a member of our Board of Directors or Executive Compensation Committee.
Proposal #2 - Approval of Amendment to Articles of Incorporation
Current Standard and Policy
Michigan law provides that directors are elected by a plurality of the votes cast unless otherwise provided in a corporation’s articles of incorporation. Because our Articles of Incorporation do not provide otherwise, our directors are currently elected by a plurality of the votes cast. This means that the director nominees with the most votes cast in their favor are elected, regardless of any withheld votes.
Description of Amendment Generally
The Board has adopted, subject to shareholder approval, an amendment to our Articles of Incorporation that would allow us to amend our Bylaws to provide that, in an uncontested election, a nominee must receive a majority of the votes cast to be elected as a director. Under this proposal, in contested elections, where the number of nominees exceeds the number of directors to be elected, the voting standard would continue to be a plurality of votes cast.
Background
Shareholders of many public companies have urged that directors be elected by a majority of the votes cast rather than being elected by a plurality of the votes cast. Under the plurality standard, the directors who receive the most votes are elected. Because the number of nominees and the number of open seats are the same in an uncontested election, a nominee need only receive a single affirmative vote to be elected. As a result, a number of public companies have adopted charter or bylaw provisions implementing a majority vote standard or have adopted bylaws or corporate governance guidelines requiring a director who does not receive a majority of votes to submit his or her resignation to the board or one of its committees. Charter or bylaw provisions implementing a majority vote standard also typically require a director who does not receive a majority of votes to submit his or her resignation to the board or one of its committees to address the typical state law provision that provides that a director remains in office until his successor is elected, even if the director has not received a vote sufficient for re-election. Michigan law has such a provision regarding director succession. As discussed above under the heading “How many votes are needed for each proposal?,” we have a resignation policy in our Governance Guidelines.
The Nominating and Governance Committee and the Board have carefully considered the arguments for and against a majority voting standard. We believe that the plurality voting standard provides greater certainty that the annual election will result in a full and duly elected board of directors. However, the Board also recognizes that requiring a majority of the votes cast ensures that only directors with broad acceptability among the voting shareholders will serve on the Board and enhances the accountability of each director to our shareholders. While the current resignation policy in our Governance Guidelines seeks to address the same issues as the proposed amendment, the proposed amendment, if adopted by the shareholders, would enable us to implement a majority voting standard and provide more certainty regarding the majority voting standard over the longer term. In recent elections, our director nominees have received votes for election that exceeded a majority of the number of our shares outstanding. As a result, the difference in voting standards would have had no impact on us. On balance, the Board has concluded that the proposed amendment to allow for a majority voting standard is in the best interest of the company and our shareholders and therefore recommends that you approve this Proposal 2.
Amendment of Articles of Incorporation
Under Michigan law, a standard for election of directors other than a plurality may be used only if the articles of incorporation provide for a different standard. If shareholders approve the amendment, then a new Article IX of our Articles of Incorporation will be added which will read as follows:
ARTICLE IX
The Bylaws of the Corporation may provide that, to the extent provided in such Bylaws, each director of the Corporation shall be elected by the affirmative vote of a majority of the votes cast with respect to the director at any meeting for the election of directors at which a quorum is present, subject to the terms and conditions set forth within such Bylaws. For purposes of clarity, the provisions of the foregoing sentence do not apply to vacancies or newly created directorships filled by a vote of the Board of Directors.
Amendments to Bylaws and Board Governance Guidelines
The Board has adopted, subject to shareholder approval of the amendment to the Articles of Incorporation described above, amendments to our Bylaws and Governance Guidelines that will become effective upon filing the Certificate of Amendment to the Articles of Incorporation with the Michigan Department of Licensing and Regulatory Affairs. The amendments to our Bylaws and Governance Guidelines do not require any shareholder action. If the shareholders do not approve the proposed amendment to the Articles of Incorporation, then the amendments to our Bylaws and Governance Guidelines will not become effective.
Proposal #2 - Approval of Amendment to Articles of Incorporation (continued)
The amendments to the Bylaws provide that each director will be elected by the majority of the votes cast with respect to that director’s election at any meeting of shareholders for the election of directors, other than a contested election. A majority of the votes cast will mean that the number of votes cast “for” a director’s election exceeds the number of votes “withheld” with respect to that director’s election. In a contested election, each director will be elected by a plurality of the votes cast with respect to that director’s election at the meeting.
The amendments to the Bylaws further provide that, in an uncontested election of directors, any nominee for director who is already serving as a director and receives a greater number of votes “withheld” from his or her election than votes “for” his or her election (a “Majority Against Vote”) will promptly tender his or her resignation. The Nominating and Governance Committee of the Board will then promptly consider the resignation submitted by a director receiving a Majority Against Vote, and the committee will recommend to the Board whether to accept the tendered resignation or reject it.
The Board will act on the committee’s recommendation no later than 90 days following the date of the shareholders’ meeting at which the election occurred. In considering the committee’s recommendation, the Board will consider the factors considered by the committee and such additional information and factors the Board believes to be relevant. Following the Board’s decision, we will promptly publicly disclose the Board’s decision whether to accept the resignation as tendered, including a full explanation of the process by which the decision was reached and, if applicable, the reasons for rejecting the tendered resignation.
Any director who tenders a resignation pursuant to this provision will not participate in the committee recommendation or the Board consideration regarding whether to accept the tendered resignation. The amendments to the Bylaws also set forth a procedure for acting if a majority of the members of the committee receive Majority Against Votes at the same election.
In light of the proposed addition of a director resignation policy in our Bylaws, the amendment to the Governance Guidelines that the Board has adopted, subject to shareholder approval of the amendment to the Articles of Incorporation, would remove the director resignation policy that is currently part of that document.
Required Vote
The approval of the amendment to the Articles of Incorporation requires the affirmative vote of a majority of the outstanding shares entitled to vote on this proposal.
The Board of Directors recommends a vote FOR this proposal.
Proposal #3 - Ratification of Appointment of Independent Registered Public Accounting Firm
Our Audit Committee has appointed Ernst & Young LLP (Ernst & Young) as our independent registered public accounting firm for the fiscal year ending June 3, 2017.1, 2019. Representatives of Ernst & Young will be present atparticipate in the Annual Meeting of Shareholders and will be available to respond to appropriate questions submitted in advance. Shareholders may submit questions in advance by logging on to www.virtualshareholdermeeting.com/MLHR18. The Ernst & Young representatives will have the opportunity to make a statement if they so desire.
Although the submission of this matter for approval by shareholders is not legally required, our Board of Directors believes that such submission follows sound corporate business practice and is in the best interests of our shareholders. If our shareholders do not approve the selection of Ernst & Young, the selection of this firm as our independent registered public accounting firm will be reconsidered by the Audit Committee. This ratification of the appointment of Ernst & Young requires the affirmative vote of a majority of the votes cast on this proposal. Unless otherwise instructed by you, brokers, banks, and other street name holders will have the discretionary authority to vote your shares on this matter.
The Board of Directors recommends a vote FOR the ratification of the appointment of Ernst & Young LLP as our independent registered public accounting firm.
Disclosure of Fees Paid to Independent Auditors
Aggregate fees billed to us for the fiscal years ended May 30, 2015June 3, 2017 and May 28, 2016,June 2, 2018, by our independent registered public accounting firm, Ernst & Young were as follows:
| | | Fiscal Year Ended | May 30, 2015 |
| May 28, 2016 |
| June 3, 2017 |
| June 2, 2018 |
|
Audit Fees(1) | 1,563,000 |
| 1,585,552 |
| $ | 1,865,000 |
| $ | 2,153,500 |
|
| Audit Related Fees | — |
| — |
| — |
| — |
|
Tax Fees(2) | 25,300 |
| 20,773 |
| 136,920 |
| 445,000 |
|
| Total | $ | 1,588,300 |
| $ | 1,606,325 |
| $ | 2,001,920 |
| $ | 2,598,500 |
|
| |
| (1) | Includes fees billed for the audit of and accounting consultations related to our consolidated financial statements included in our annual reportAnnual Report on Form 10-K, including the associated audit of our internal controls, the review of our financial statements included in our quarterly reports on Form 10-Q, and services in connection with statutory and regulatory filings. |
| |
| (2) | Includes fees billed for tax compliance, tax advice and tax planning. |
Our Audit Committee has adopted a policy for pre-approving services performed by Ernst & Young and other firms. This policy requires the Committee's pre-approval of all services that may be provided by our independent registered public accounting firm and certain audit services provided by other firms. The policy authorizes the committee to delegate to one or more of its members pre-approval authority with respect to permitted services. All of the services provided by Ernst & Young under the captions “Audit Fees,” “Audit Related Fees,” and “Tax Fees” were approved by the Audit Committee under this policy.
Report of the Audit Committee
The Audit Committee’s purpose is to oversee the accounting and financial reporting processes of the company;company, the audits of the company’s financial statements and management’s assessment of the company’s internal controls;controls, the qualifications of the public accounting firm engaged as the company’s independent registered public accounting firm;firm, and the performance of the company’s internal auditors and independent registered public accounting firm. The Committee’s function is more fully described in its charter, which the Board has adopted and is available on the Company'scompany's web site at http://www.hermanmiller.com/content/dam/hermanmiller/documents/investors/audit_committee_charter.pdf. The Committee reviews the charter on an annual basis. The Board annually reviews the NASDAQ listing standards definition of independence for audit committee members and has determined that each member of the Committee meets that standard.
Management is responsible for the preparation, presentation, and integrity of the company’s financial statements, accounting and financial reporting principles, internal controls, and procedures designed to ensure compliance with accounting standards, applicable laws, and regulations. The company’s independent registered public accounting firm, Ernst & Young LLP, is responsible for performing an independent audit of the consolidated financial statements and expressing an opinion on the conformity of those financial statements with U.S. generally accepted accounting principles. Ernst & Young LLP is also responsible for auditing and providing an opinion on the effectiveness of the company’s internal control over financial reporting.
We have reviewed-andreviewed and discussed, with management and Ernst & Young LLP-theLLP, the company’s audited financial statements for the year ended May 28, 2016,June 2, 2018, management’s assessment of the effectiveness of the company’s internal controls over financial reporting and Ernst & Young LLP’s evaluation of the company’s internal controls over financial reporting.
We have discussed with Ernst & Young LLP the results of the independent auditors’ examinations and the judgments of the independent auditors concerning the quality, as well as the acceptability, of the Company’scompany’s accounting principles and such other matters that we are required to discuss with the independent auditors under applicable rules, regulations or generally accepted auditing standards, including the matters required to be discussed by applicable rules of the Public Company Accounting Oversight Board (PCAOB). We have also received and reviewed the written disclosures and the letter from Ernst & Young LLP per the applicable requirements of the PCAOB regarding Ernst and Young LLP's communications with the Audit Committee around independence and we have discussed with Ernst & Young LLP their independence including a consideration of the compatibility of non-audit services with their independence.
Based on the reviews and discussions referred to above, we recommended to the Board of Directors that the financial statements referred to above be included in the company’s Form 10-K Report for the year ended May 28, 2016,June 2, 2018, and we selected Ernst & Young LLP as the independent auditor for fiscal year 2017.2019. The Board is recommending that shareholders ratify that selection at the annual meeting.
|
| | |
Lisa A. Kro (chair)(Chair) | Heidi J. Manheimer | Douglas D. French |
Proposal #3#4 - Proposal to Approve, on an Advisory Basis, the Compensation Paid to the Company's Named Executive Officers
Consistent with our Board's recommendation, as approved by our shareholders and as required pursuant to Section 14A of the Securities Exchange Act, we allow our shareholders the opportunity to vote, on an advisory and annual basis, on the compensation of our named executive officers. As a result,officers ("say on pay"). Thus, you are asked to vote upon the following resolution at this year's annual meeting,meeting.
We have designed the compensation of the named executive officers to vary based on the performance of the business and to reward consistent improvement in the results delivered to shareholders. In fiscal 2018, we approved changes in the compensation of each executive officer primarily to maintain competitive pay levels for each position. The Committee believes that the compensation to each named executive officer as disclosed in the Compensation Discussion and Analysis is appropriate in the light of the company's and the officer's performance during the fiscal year.
The Executive Compensation Committee ("Committee") has considered the results of the 2017 Say on Pay vote - in which approximately 82% of the votes cast were voted for the approval, on an advisory basis, of the compensation of our named executive officers as described in the 2017 Proxy Statement. Around the time of that advisory vote, members of management contacted 13 of our largest shareholders, representing approximately 25% of total shares outstanding. Some investors shared their desire to see a relative measure of performance as part of our executive long-term incentive awards. The Committee considered our investors' feedback and the outcome of the vote in general when considering future NEO compensation design features, including the addition of relative total shareholder return (TSR) measure to the long-term incentive awards for fiscal 2019. See page 27 for more information regarding our shareholder outreach process.
Shareholders are being asked to approve the following resolution at the Annual Meeting:
“RESOLVED, that the compensation paid to the Company'scompany's named executive officers, as disclosed in the Company's proxy statementcompany's Proxy Statement for this annual meeting pursuant to the rules of the SEC, including the Compensation Discussion and Analysis, the compensation tables and narrative disclosure, is hereby APPROVED."
The Executive Compensation Committee ("Committee") has considered the results of the 2015 advisory vote on executive compensation in which more than 98% of the votes cast were voted for the approval, on an advisory basis, of the compensation of our named executive officers as described in the 2015 Proxy Statement. Consistent with those voting results, the Committee believes that the total compensation paid to the Chief Executive Officer and the other named executive officers, as disclosed in the Compensation Discussion and Analysis, is fair and appropriate and should be approved by our shareholders. The compensation of the named executive officers is designed to vary with the results of the business and to reward consistent improvement in the results delivered to shareholders. In fiscal year 2016, changes in the base compensation of each executive officer primarily reflect changes in the benchmarking data for the position. The change in the variable element of each executive's compensation reflects our financial and related performance relative to performance criteria approved by the Committee and Board. The Committee believes that the compensation to each named executive officer as disclosed in the Compensation Discussion and Analysis is appropriate in the light of the Company's and the officer's performance during the fiscal year. In addition, each of the elements of compensation at target has been benchmarked against comparable positions.
Shareholders will have a similar opportunity to vote on this subject at our next annual meeting of shareholders.
The Board of Directors recommends a vote FOR this proposal.
This vote is advisory and non-binding; however, the Board of Directors and Committee will review and consider the voting results in connection with future deliberations concerning our executive compensation program.
Voting Securities and Principal Shareholders
On August 12, 2016,10, 2018, we had 60,010,54059,497,056 shares of common stock issued and outstanding, par value $.20 per share. Shareholders are entitled to one vote for each share of common stock registered in their names at the close of business on August 12, 2016,10, 2018, the record date for the Annual Meeting fixed by our Board of Directors. Votes cast at the meeting and submitted by proxy will be tabulated by Broadridge Financial Solutions, Inc. As of August 12, 2016,10, 2018, no person was known by management to be the beneficial owner of more than five percent of our common stock, except as follows.
|
| | |
| Name and Address of Beneficial Owner | Amount and Nature of Beneficial Ownership | Percent of Class |
The Vanguard Group, Inc.(1) | 5,406,011 | 9.01 |
| PO Box 2600 | | |
| Valley Forge, PA 19482 | | |
BlackRock, Inc.(2) | 5,098,068 | 8.50 |
| 400 Howard Street | | |
| New York, NY 10022 | | |
|
| | | |
| Name and Address of Beneficial Owner | Amount and Nature of Beneficial Ownership | Percent of Class |
BlackRock, Inc.(1) | 6,934,391 |
| 11.66 |
| 55 East 52nd Street | | |
| New York, NY 10055 | | |
The Vanguard Group, Inc.(2) | 5,796,909 |
| 9.74 |
| PO Box 2600 | | |
| Valley Forge, PA 19482 | | |
| |
| (1) | This information is based solely upon information as of June 30, 20162018, contained in a filingfilings with the SEC on August 10, 20169, 2018 by The Vanguard GroupBlackRock, Inc., including notice that it has, along with certain institutional investment managers for which it is the parent holding company, sole voting power as to 126,6926,749,436 shares and sole dispositive power as to 5,275,307 shares, and shared voting power with respect to 7,006 shares and shared dispositive power with respect to 130,7046,934,391 shares. |
| |
| (2) | This information is based solely upon information as of June 30, 20162018, contained in filingsa filing with the SEC on August 10, 201614, 2018 by BlackRock Fund Advisors and BlackRock Institutional Trust Company NA,The Vanguard Group Inc., including notice that they have, collectively,it has sole voting power as to 4,955,984113,274 shares and sole dispositive power as to 5,098,0685,681,210 shares, and shared voting power with respect to 8,106 shares and shared dispositive power with respect to 115,699 shares. |
Director and Executive Officer Information
Security Ownership of Directors
The following table shows, as of August 12, 2016,10, 2018, the number of shares beneficially owned by each of the nominees and directors, except for Brian Walker who is reported in Security Ownership of Management below.directors. Except as described in the notes following the table, the following persons have sole voting and dispositive power as to all of their respective shares.
| | | Name | Amount and Nature of Beneficial Ownership(1) | Percent of Class(2) | Amount and Nature of Beneficial Ownership | Percent of Class(1) |
| Mary Vermeer Andringa | 41,465 |
| 0.07 |
| 41,550 |
| 0.07 |
|
| David A. Brandon | 16,337 |
| 0.03 |
| 16,809 |
| 0.03 |
|
Brenda Freeman | — |
| 0.00 |
| — |
| — |
|
| Douglas D. French | 10,172 |
| 0.02 |
| 11,618 |
| 0.02 |
|
| J. Barry Griswell | 20,864 |
| 0.03 |
| 20,913 |
| 0.04 |
|
| John R. Hoke III | 29,040 |
| 0.05 |
| 30,269 |
| 0.05 |
|
| Lisa A. Kro | 15,743 |
| 0.03 |
| 19,978 |
| 0.03 |
|
| Heidi J. Manheimer | 7,789 |
| 0.01 |
| 13,193 |
| 0.02 |
|
| Dorothy A. Terrell | 24,877 |
| 0.04 |
| |
| David O. Ulrich | 53,615 |
| 0.09 |
| |
| Brian C. Walker | see table below |
| | see table below |
| |
| Michael A. Volkema | 75,000 |
| 0.12 |
| 75,000 |
| 0.13 |
|
| |
| (1) | Shares shown for each director include the following number of shares that each director has the right to acquire beneficial ownership under stock options exercisable within 60 days: 15,183 shares for Ms. Terrell; and 38,048 shares for Dr. Ulrich. |
| |
(2) | Percentages are calculated based upon shares outstanding plus shares that may be acquired under stock options exercisable within 60 days. |
| |
| (2) | Ms. Freeman’s deferred compensation account allocation holds 8,171 shares of Herman Miller stock which would equate to a Percent of Class of 0.01. Mr. French's deferred compensation account holds 3,756 shares which would equate to an additional Percent of Class of 0.01. |
Security Ownership of Management
The following table shows, as of August 12, 2016,10, 2018, the number of shares beneficially owned by each of the Named Executive Officers (NEOs) identified in the executive compensation tables of this Proxy Statement, and by all directors and executive officers as a group. Except as described in the notes following the table, the following persons have sole voting and dispositive power as to all of their respective shares.
| | | Name | Amount and Nature of Beneficial Ownership(1) |
| Percent of Class(2) |
| Amount and Nature of Beneficial Ownership(1) | Percent of Class(2) |
| Brian C. Walker | 547,784 |
| 0.91 |
| 56,301 |
| 0.09 |
|
| Jeffrey M. Stutz | 16,791 |
| 0.03 |
| 64,232 |
| 0.11 |
|
| Gregory J. Bylsma | 70,094 |
| 0.12 |
| 109,333 |
| 0.18 |
|
| Andrew J. Lock | 62,355 |
| 0.10 |
| 4 |
| — |
|
| B. Ben Watson | 32,751 |
| 0.05 |
| 72,989 |
| 0.12 |
|
All executive officers and directors as a group (26 persons)(3) | 1,146,722 |
| 1.91 |
| |
All executive officers and directors as a group (20 persons)(3) | | 626,185 |
| 1.05 |
|
| |
| (1) | Includes the following number of shares with respect to which the NEOs have the right to acquire beneficial ownership under stock options exercisable within 60 days: 243,844no shares for Mr. Walker; 8,18448,423 shares for Mr. Stutz; 24,94159,795 shares for Mr. Bylsma; 32,428no shares for Mr. Lock; and 16,75149,423 shares for Mr. Watson. |
| |
| (2) | Percentages are calculated based upon shares outstanding plus shares that may be acquired under stock options exercisable within 60 days. |
| |
| (3) | Included in this number are 436,968226,915 shares with respect to which executive officers and directors have the right to acquire beneficial ownership under options exercisable within 60 days. |
Letter from the Committee Chair
Dear Fellow Herman Miller Shareholder,
Fiscal 2018 was underpinned by positive financial performance and advancement of key initiatives, while also marking the start of a key leadership transition. We announced the retirement of Brian Walker and we are both grateful for his many contributions to Herman Miller over his long career and excited for our new CEO, Ms. Andrea Owen, to lead Herman Miller going-forward.
We are proud of the successes we achieved financially and operationally during fiscal 2018 as discussed in the Financial Highlights from Fiscal 2018 section of this proxy statement. Our executive compensation programs exhibited strong alignment with this performance:
Executive annual incentive awards were paid at 92.5% of target, which reflected adjusted EBITDA performance (as described in the "Reconciliation of Non-GAAP Measures" on pg. 55) of $266.4 million versus a target of $269.0 million
Our HMVA units granted for the 2016-2018 performance period were earned at 137% of target
Our Relative TSR units granted for the 2016-2018 performance period were earned at 200% of target reflecting our 40.81% cumulative TSR over the three-year period
We conducted shareholder outreach meetings and calls before and after our fiscal 2017 Say on Pay vote, connecting with 13 holders representing approximately 25% of total outstanding shares. Our shareholders provided feedback on a number of aspects of our executive compensation program. The Executive Compensation Committee (the Committee) and management discussed this feedback, and the Committee approved changes to the programs in response. Because the feedback was received after the start of our fiscal 2018, we have made these changes effective for fiscal 2019 and beyond:
Elimination of single-trigger vesting in our equity award agreements - while our long-term incentive plan provides for double-trigger vesting it also provides for Committee discretion to define vesting treatment in individual award agreements. Beginning with the annual awards granted in July 2018, the Committee has prohibited award agreements from providing for anything other than double-trigger vesting in the event of a change-in-control.
Incorporation of performance-based long-term incentive (LTI) awards tied to the relative performance of our total shareholder return (TSR). While the company moved away from relative TSR PSUs in fiscal years 2017 and 2018 (choosing to focus on absolute TSR via stock options instead), our shareholders indicated a strong preference for a relative TSR component. Therefore, awards granted in fiscal 2019, tie 25% of our executives’ LTI awards to PSUs earned based on our relative TSR performance compared to our peer group.
Enhanced disclosure of the robust nature and conclusions of the Committee’s incentive goal setting process - shareholders expressed a desire for more clarity about the means by which we set targets for fiscal 2017 in the Herman Miller Value Added (HMVA) program. In this year’s Compensation Discussion and Analysis (CD&A), we have provided detailed information on the factors the Committee considered when setting the 2018 HMVA goals, and we will continue to provide such detail in future years’ CD&As.
These changes complement the existing strong governance and best practices already underlying our executive compensation programs to balance the inherent need to retain, motivate and attract top-quality executives while aligning them directly with long-term shareholder interests.
Our Say on Pay Proposal is found on page 22 of this proxy statement, and the Board recommends that you vote ‘FOR’ this proposal. We also invite you to consider additional information on our compensation philosophy and decisions in the CD&A, which can be found on the following pages. I am confident that our executive compensation programs motivate the behaviors and results the Board and our shareholders expect.
Sincerely,
J. Barry Griswell
Chair, Board Executive Compensation Committee
Compensation Discussion and Analysis
Executive Summary
Fiscal Year 2016 Company Performance
We continued to make significant progress in fiscal year 2016 toward our long-term vision and financial objectives: delivering on our SHIFT strategy for diversified growth, expanding into higher margin segments and categories, and continuing to enhance the Herman Miller global brand. In addition to meaningful progress on our long-term objectives, we achieved increased sales and orders for the sixth consecutive year and delivered record consolidated revenue of $2.26 billion in fiscal year 2016. Strong margin performance coupled with effective expense management helped offset foreign exchange headwinds and resulted in further improvements in adjusted EBITDA, which is discussed elsewhere in this Proxy Statement. We also continued to maintain a strong balance sheet and cash flow profile. As a result of this strong performance, we recently announced an increase to our quarterly dividend rate beginning in October 2016.
As discussed below, the compensation that we paid to our named executive officers for fiscal year 2016 reflects a strong link between executives’ total annual compensation and the company’s performance. In fiscal year 2016, we modified our executive compensation program by increasing the amount of compensation that is classified as performance-based compensation and reconfigured our long-term incentive compensation program to better align long-term leadership rewards with long-term shareholder value. Examples of these actions include:
we increased the significance of amounts earned that will depend on performance objectives over a 3-year cycle;
we tied special grants of options to NEOs and others to the achievement of higher sales and EBITDA in fiscal year 2016;
we also tied those special grants to the establishment of higher targeted EBITDA growth in fiscal year 2017;
we elected to grant options in lieu of Relative TSR Performance Share Units to all NEOs, commencing with LTI grants in fiscal year 2017 since options will provide an additional incentive to increase the underlying stock price; and
we imposed a cap on the total value of LTI grants that will be approved in fiscal 2017. The cap is tied to the company’s ability to maintain and grow EBITDA.
We believe our compensation programs are structured to correlate strongly with our company strategy to attain our business objectives and to deliver significant shareholder value. We discuss our compensation plans and philosophy in greater detail in this Compensation Discussion and Analysis.
The Board Executive Compensation Committee (Committee) annually requests that Pearl Meyer & Partners evaluate the relationship between our executive compensation and our financial performance. For fiscal year 2016, the Committee reviewed a historical assessment of the relationship between the company’s financial performance and executive pay relative to our fiscal year 2016 peer group (as set forth below). The following graph illustrates the results of the Committee’s core assessment and illustrates the relationship between:
| |
(1) | Our CEO’s (and other NEOs’: 2-5) total direct compensation (base salary earned, incentives earned, value of restricted stock units or (RSUs) that vest during the period, performance share units (PSUs) that vested during the period, value of stock options (where applicable) exercised during the period, and changes in value of unvested RSUs/PSUs and unexercised options held during the period; and |
| |
(2) | The company’s performance as measured by total shareholder return (“TSR”) - over a three-year period (fiscal 2013 - 2015). |
The data points within the shaded area of the graph designate ideal relationships between pay and performance. Data points below the shaded area identify an area where pay was lower than expected given the organization’s performance. The data points above the shaded area identify an area where pay was higher than expected given the organization’s performance.
Compensation Discussion and Analysis (continued)
In the graph above referencing CEO Pay for Performance, compensation realized by the Company’s CEO in fiscal year 2015 ranked at the 19th percentile, our TSR ranked at the 23rd percentile, indicating that our CEO’s compensation was within the range expected given our performance relative to peer results.
In the graph above referencing Ranks 2-5 Pay for Performance, compensation realized by the Company’s other NEOs in fiscal year 2015 ranked at the 9th percentile, our TSR ranked at the 19th percentile, indicating that our other NEOs’ compensation was within the range expected given our performance relative to peer results.
Executive Officers Covered by this Compensation Discussion and Analysis
For fiscal year 2016, weWe are required to provide information regarding our compensation policies and decisions relating to our President and Chief Executive Officer (CEO), our Chief Financial Officer (CFO) and the three other most highly compensated executive officers serving as executive officers at the end of the year. We refer to our CEO, our CFO and the other executive officers for whom disclosure is required as our “named executive officers” or “NEOs.” This (‘CEO’ and ‘NEOs’ are referenced earlier in the document)“NEOs”. We intend this Compensation Discussion and Analysis is intended to provide information regarding, among other things, the overall objectives of our compensation programsprogram and each element of compensation we provided to the NEOs.
The NEOs for fiscal year 20162018 and their titles are listed in the following table:
|
| |
| Name | Title |
| Brian C. Walker | President and Chief Executive Officer (retiring effective August 21, 2018) |
| Jeffrey M. Stutz | Executive Vice President and Chief Financial Officer |
| Gregory J. Bylsma | Executive Vice President, and Chief Operating Officer of Herman Miller North America Work and LearningContract |
| Andrew J. Lock | Executive ViceFormer President, and President of Herman Miller International (retired July 31, 2018) |
| B. Ben Watson | ExecutiveChief Creative DirectorOfficer |
Fiscal 2018 Company Performance
We continued to make significant progress in fiscal 2018 toward our long-term vision and financial objectives: delivering on our strategy for diversified growth, expanding into higher margin segments and categories, and continuing to enhance the Herman Miller global brand. In addition to meaningful progress on our long-term objectives, we achieved increased sales and orders for the eighth consecutive year and delivered consolidated revenue of $2,381.2 million in fiscal 2018. Revenue growth, strong expense management and a lower tax rate helped offset commodity and pricing headwinds to deliver adjusted EPS 6% ahead of the prior year, which is discussed elsewhere in this Proxy Statement. We also continued to maintain a strong balance sheet and cash flow profile. As a result of this financial performance, we recently announced a 10% increase to our quarterly dividend rate beginning in October 2018.
Alignment of Pay and Performance
In fiscal 2018, consistent with prior years, the Board’s Executive Compensation Committee (Committee) reviewed multi-year analyses that evaluated the relationship between CEO realizable pay and financial performance (including total shareholder return) for Herman Miller and its peer group companies (described below in detail in the section entitled "Benchmarking of Compensation"). The Committee conducts these analyses to ensure the desired linkage between executive pay and company performance.
The following graph illustrates the relationship, compared to our peers, between:
CEO Realizable Pay (fiscal years 2015 through 2017 which is the most recent 3-year time period for which peer data is available): Calculated as the sum of annual base salary, actual annual incentive award paid and the value of stock awards granted (based on each company’s fiscal year end closing stock price) divided by target pay
Total Shareholder Return (TSR): Annualized TSR for fiscal years 2015 through 2017
Compensation Discussion and Analysis (continued)
2017 Say on Pay Vote and Shareholder Outreach During Fiscal Year 2018
At the 2015 annual shareholders’ meeting, our shareholders overwhelmingly approved, on an advisory basis, the compensation we paidPrior to our NEOs during2017 Say on Pay Vote, we had historically received overwhelming support of our executive compensation program, averaging 98%. Around the time of the 2017 Annual Shareholders Meeting, we contacted shareholders over the course of the proxy voting period to hear their views regarding our executive compensation program. A majority of the investors with whom we spoke supported our compensation program, which was further exhibited by 82% of shareholders voting in favor of our 2017 Say on Pay proposal.
When engaging with shareholders in fiscal 2018, around the time of our 2017 Annual Shareholders Meeting, the discussions focused primarily on the following items regarding our compensation program:
|
| |
| What We Heard; | What We Did: |
| A portion of our long-term incentive awards should factor in relative performance measures | We added PSUs, based on relative TSR compared to the peer group to the fiscal 2019 LTI mix |
| It is not clear how the Committee sets goals for the Herman Miller Value Added Performance Share Units | We have provided additional details below to provide further clarity on our goal setting process and will continue to do so in future years |
| All equity awards should be double-trigger | At its June 2018 meeting the Committee decided that all equity awards, starting with those granted in July 2018, will be double-trigger. |
| |
| 1. | Our Long-Term Incentive Mix. Our Committee regularly reviews the mix of our incentives. For awards granted to NEOs in fiscal 2018, the LTI value was equally split among performance shares units, restricted stock units and stock options. Based on investor feedback, we increased the weighting for performance share units (from 33% to 50%) and added a relative TSR metric (see the "Compensation Program Changes for Fiscal 2019" section for additional details). |
| |
| 2. | How We Set Performance Goals for our Herman Miller Value Added Performance Share Units. Our Herman Miller value added performance share units vest if the company’s annual earnings before interest, taxes, depreciation and amortization (EBITDA) less a capital charge exceed certain pre-established goals. We refer to EBITDA less a capital charge as HMVA. Each year we set the level of HMVA needed for threshold, target, and maximum payout based on a certain average annual percentage increase over the three year performance period. In absolute terms, the threshold and maximum performance goals for the 2018-2020 awards were lower than those for the 2017-2019 awards. |
Compensation Discussion and Analysis (continued)
This was primarily due to our fiscal 2017 year being comprised of 53 weeks, but our 2018 fiscal year 2015.only being comprised of 52 weeks. As a result, we adjusted our fiscal 2017 HMVA to exclude the impact of the extra week of operations for the purpose of setting our fiscal 2018 HMVA performance goals. After such adjustment, our actual fiscal 2016 HMVA (which served as the starting point for our fiscal 2017-2019 HMVA performance goals) was higher than our actual fiscal 2017 HMVA (which served as the starting point for our fiscal 2018 HMVA performance goals). When adjusted for this factor, our 2018-2020 goals are equally aggressive to those of the prior cycle and reflect significant growth over prior years. As such, our threshold and maximum goals for our fiscal 2018-2020 HMVA awards were, in absolute dollar terms, less than our threshold and maximum goals for our fiscal 2017-2019 HMVA awards. But, they remained unchanged from our fiscal 2017-2019 HMVA in terms of the percentage increase required for threshold and maximum payout. The table below illustrates our HMVA goals for the three most recent performance cycles.
|
| | | |
| Payout % of Target | 2018-2020 Average Value Added | 2017-2019 Average Value Added | 2016-2018 Average Value Added |
| 200% of Target PSUs | $230 million or more | $239 million or more | $193 million or more |
| 100% of Target PSUs | $210 million | $210 million | $170 million |
| No PSUs earned | Less than $183 million | Less than $191 million | Less than $154 million |
| Capital Charge | 10% | 10% | 10% |
| |
| 3. | How We Treat Equity Awards Upon a Change in Control. Our 2011 Long-Term Incentive Plan provides that, upon a change in control, if the surviving company assumes an award (or if we are the surviving company), then the vesting of the award will be accelerated only if the award recipient’s employment is terminated under certain circumstances within two years of the change in control (a “double-trigger”). However, the plan allows an award agreement to provide for different treatment, and the terms of certain restricted stock unit and performance share unit award agreements that we have provided to our NEOs state that the awards will vest immediately upon a change in control. We quantify the benefits that each named executive officer would receive upon a change in control in the table under the heading “Potential Payments upon Termination, Death, Disability, Retirement or Change in Control.” Starting in July 2018, all equity award agreements will be double-trigger. |
The Committee believes that the performance of our executive compensation programsprogram during fiscal year 20162018 was consistent with our compensation philosophy and objectives, as describedwe describe below, and that the compensation we paid to our NEOs was appropriate givenand reflective of our overall performance. However, we value investor input and, based on the suggestions of our investors, we made several changes to our long-term incentive compensation for fiscal 2019 (see the “Changes to Compensation Program for 2019 -Long-Term Equity Incentives” section below).
Our shareholders will have the opportunity to cast an advisory “Say on Pay” vote at this year’s annual meeting as well. The Committee will take the vote into consideration when evaluating the effectiveness of the company’s executive compensation programs.program.
Overview of Compensation Philosophy and How We Set Pay
Overview of Compensation Program
We have designed our compensation program to provide corporate officers who perform their duties at a proficient level with the opportunity to earn compensation that reflects the market median compensation for their position based upon data that our independent compensation consultant provides (as we describe in the section on Benchmarking of Compensation). The compensation program requires that a majority of the corporate officer’s compensation be determined based upon the company’s performance. The Committee believes that the compensation program, through the use of base salary, an annual incentive and long-term incentive awards, operates in a manner consistent with these objectives. The Committee also believes that the compensation program rewards performance that generates both consistent and long-term enhancement of shareholder value.
Compensation Discussion and Analysis (continued)
Compensation Philosophy
The goal of ourCommittee's compensation philosophy is to allow for an appropriate level of risk and a corresponding compensation reward within a range that bears a relationship to the competitive market, to the responsibilities of the employee and to the performance of the employee and our company. Consistent with this philosophy, the key objectives of our executive compensation program are to:
Link a material portion of executives' total annual compensation directly to the company's performance
Reinforce our values, build corporate community, and focus employees on common goals
Align the interests of executives with the long-term interests of shareholders
Attract, motivate, and retain executives of outstanding ability
Compensation Discussion and Analysis (continued)
Compensation Policies and Practices That Reflect Our Compensation Philosophy
Role of the Committee
The Committee consists of three directors, each qualifying as independent under NASDAQ’s listing requirements. The Board has determined that each member of the Committee also meets the definition of independence under our corporate governance guidelines and qualifies as a non-employee director for purposes of Rule 16b-3 under the Securities Exchange Act of 1934.
The Committee’s primary functions are to oversee the compensation philosophy and strategy, to determine or recommend the compensation of company officers, including the NEOs, and to act as the Administrative Committee for our executive compensation plans.
The Committee is also responsible for providing recommendations to the full Board with respect to all aspects of the annual compensation of our President and CEO. In addition, the Committee, based upon recommendations from our CEO, approves the annual compensation for all other officers covered by Section 16 of the Securities Exchange Act of 1934 including the NEOs (Corporate Officers). Our President and CEO establishes the base salary of all other executives.
Among other responsibilities, the Committee establishes the performance objectives for the Executive Incentive Cash Bonus Plan and our equity-based compensation plans, which cover the President and CEO, other Corporate Officers, and other executive employees.
The Committee is also tasked to review and advise on the compensation philosophy and strategy of the company, review and approve compensation and benefit plans as required by the Committee Charter, and review the annual compensation plans’ risk analysis.
Compensation Discussion and Analysis (continued)
Role of the External Compensation Consultants
The Committee has the authority and sole discretion to select independent compensation consultants, legal consultants and other advisors to provide it independent advice. During fiscal year 2016, the Committee retained Pearl Meyer as independent compensation consultants with respect to the compensation matters regarding our Corporate Officers. The independent services that Pearl Meyer provided to the Committee included reviewing the elements of compensation of the President and CEO as well as the other Corporate Officers and comparing those elements to our compensation philosophy and objectives and to market practices. We did not permit Pearl Meyer to provide other consulting services to the company.
Pearl Meyer concluded that our compensation program established for those officers is consistent with our compensation philosophy and objectives as well as with market practices.
With the approval of the Committee, we retained Meridian Compensation Partners LLC in fiscal year 2016 to provide marketplace compensation data and compensation consulting services to management for employees other than the Corporate Officers.
Overview of Compensation Program
Our compensation program is designed to provide Corporate Officers who perform their duties at a proficient level with compensation that reflects the market median compensation for their position based upon data that our independent compensation consultant provides (as described in the section on Benchmarking of Compensation). The compensation program also requires that a portion of the Corporate Officer’s compensation be determined based upon the company’s performance. The Committee believes that the compensation program, through the use of base salary, annual incentive cash bonus and long-term incentives, operates in a manner consistent with these objectives. The Committee also believes that the compensation program rewards performance that generates both consistent and long-term enhancement of shareholder value.
Benchmarking of Compensation
To ensure that executive compensation is competitive, the Committee uses marketplace compensation data to compare our compensation programs to general market pay practices. The Committee in fiscal year 2016 also used a specific peer group both for benchmarking compensation and for measuring performance under Relative TSR Performance Share Unit Awards that we granted (we list the members of the peer group in the Additional Compensation Information, Peer Group section later in this Compensation Discussion and Analysis). This peer group includes both direct competitors as well as comparable companies in other industries. The Committee believes the competitive market for executive talent in which we operate extends beyond the office furniture industry.
Pearl Meyer used the peer group information along with the following survey sources when analyzing fiscal year 2016 market competitiveness pay levels of Corporate Officers: Willis Towers Watson Executive Compensation Database, Aon Hewitt Executive Total Compensation Database, Mercer Executive Database and Equilar Insight Database (we refer to the peer group information and these survey sources collectively as “Survey Data”). We use the Survey Data to determine competitiveness of base pay, cash incentive bonus and long-term incentive awards. Pearl Meyer uses a regression analysis and aging to make allowances for time differences in the data and to align the data so that it is representative of companies having revenues equivalent to the operations that our individual Corporate Officers manage. Pearl Meyer compares the base salary, target total cash and target total direct compensation of each Corporate Officer to the 25th, 50th (market median) and 75th percentile of the Survey Data for a comparable benchmark position.
Pearl Meyer provided the Committee with benchmarking data, market practices and trends, peer group selection and pay for performance evaluation information to provide appropriate context for the Committee’s deliberations. Our CEO makes recommendations to the Committee regarding the compensation package for each of the Corporate Officers (other than himself). The CEO bases his recommendations with respect to Corporate Officers on the Pearl Meyer information, his evaluation of the individual’s performance, the company’s performance and other factors. The Committee bases its approval of the CEO’s recommendations for the compensation of Corporate Officers (other than the CEO) on the Committee’s review of the information from Pearl Meyer relative to market pay, advice from Pearl Meyer and the Committee members’ own judgment, including their judgment on the relative performance of both the company and its Corporate Officers. Based upon these same factors relative to the CEO's performance, the Committee makes a recommendation to the full Board for the CEO’s compensation. The Board of Directors determines the compensation of the CEO. |
| |
| What We Do |
| a | Pay for Performance |
| a | Balance Long-Term and Short-Term Incentives |
| a | Benchmark Compensation Against an Appropriate Peer Group |
| a | Maintain Clawback Right |
| a | Monitor for Risk-Taking Incentives |
| a | Maintain Stock Ownership Requirements |
| a | Prohibit Hedging |
| a | Limit Perquisites |
| a | Engage an Independent Compensation Consultant |
| a | Hold Executive Sessions at Each Committee Meeting |
| What We Do Not Do |
| x | No Gross-Ups for Taxes |
| x | No "Single Trigger" Severance |
| x | No Repricing of Options |
| x | No Guaranteed Compensation |
| x | No Dividends on Unvested Equity |
| |
Compensation Discussion and Analysis (continued)
Elements of the Compensation Program
The following table provides an executive summary of our fiscal year 20162018 compensation programsprogram for our Corporate Officers:corporate officers:
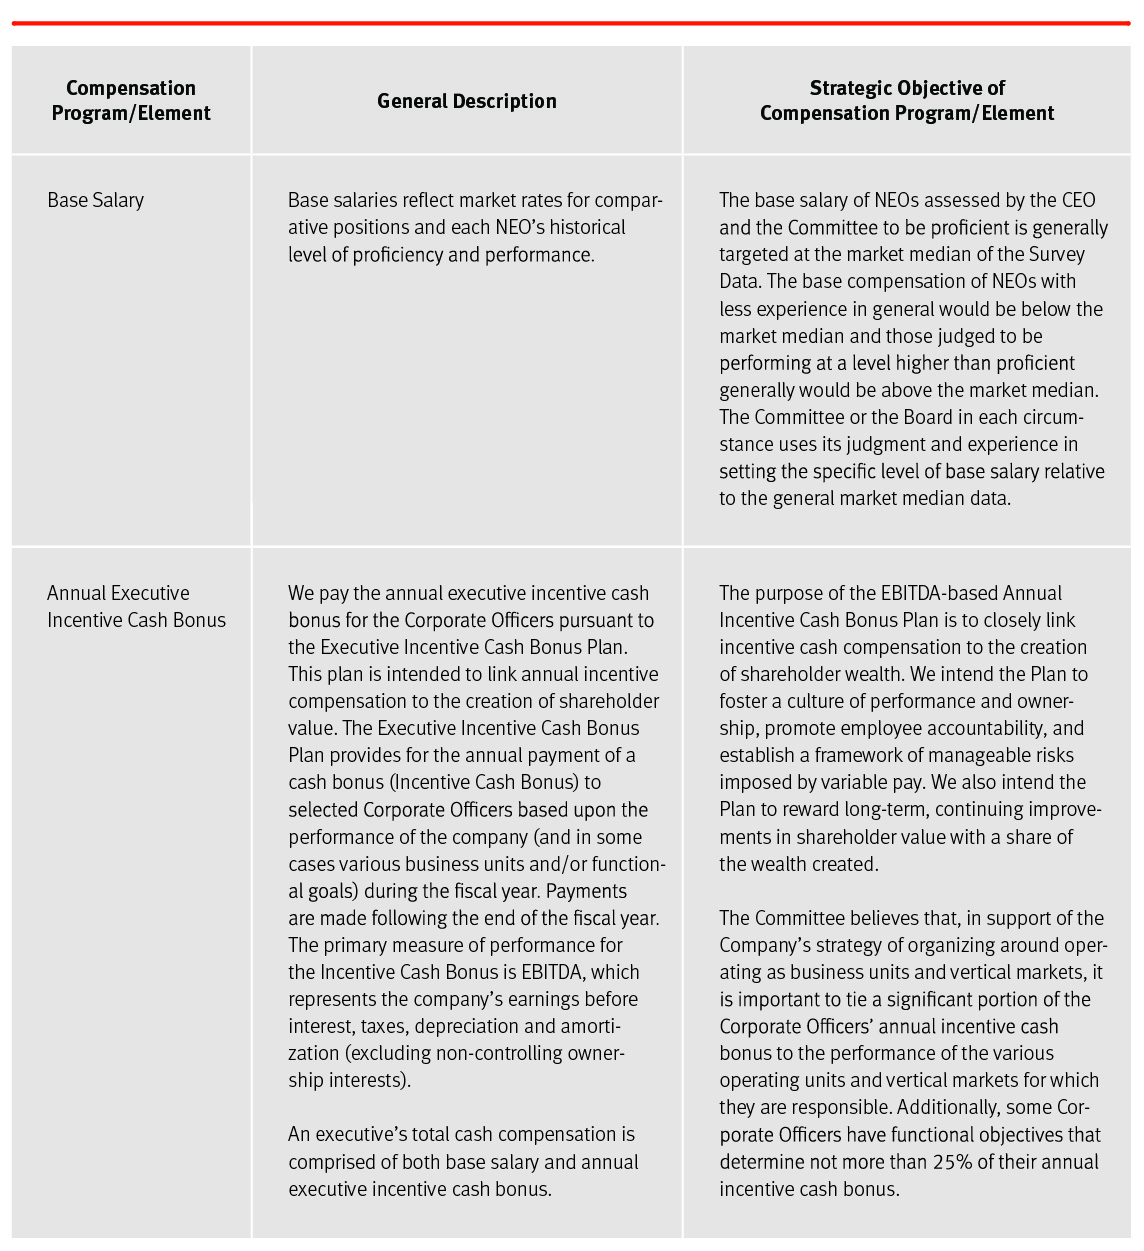
|
| | |
|
| Compensation Element | General Description | Objective of Compensation Element |
| Base Salary | Base salaries reflect market rates for comparative positions and each NEO's historical level of proficiency and performance. | The base salary of NEOs typically varies around the median depending on an individual’s experience, performance and internal equity considerations. The Committee or the Board in each circumstance uses its judgment and experience in setting the specific level of base salary relative to the general market median data. |
| Annual Incentive | We provide corporate officers the opportunity to earn an incentive bonus pursuant to the Annual Executive Incentive Cash Bonus Plan. The plan provides for the annual payment of a cash bonus (incentive bonus) to selected corporate officers based upon the performance of the company (and in some cases, various business units and/or functional goals) during the fiscal year. The primary measure of performance for the bonus is EBITDA, which represents the company's earnings before interest, taxes, depreciation and amortization (excluding non-controlling ownership interests). | The purpose of the EBITDA-based Annual Executive Incentive Cash Bonus Plan is to closely link incentive cash compensation to the creation of shareholder value. We intend for the plan to foster a culture of performance and ownership, promote employee accountability, and establish a framework of manageable risks imposed by variable pay. We also intend the plan to reward long-term, continued improvements in shareholder value with a share of the wealth created. |
| The Committee believes that, in support of the company's strategy organizing around operating as a business unit and vertical markets, it is important to tie a significant portion of the corporate officers' cash bonus to the overall performance of the various operating units and vertical business that is within the officer's span of control. Additionally, some corporate officers have functional objectives that determine up to 25% of their annual incentive bonus. |
An executive's total cash compensation is comprised of both base salary and annual incentive bonus.
|
| Long-Term Equity Incentives | The Committee and Board have historically granted various types of long-term incentive awards: Restricted Stock, Restricted Stock Units, Herman Miller Value Added Performance Share Units, Relative TSR Performance Share Units, and Stock Options. | The key objectives of granting long-term equity incentive awards are: |
| - to provide an appropriate level of equity reward to corporate officers that ties a meaningful part of their compensation to the long-term returns generated for shareholders. |
| - to provide an appropriate equity award to the next level of corporate officers where market data would support their inclusion in an annual equity award plan. |
| - to assist the achievement of our share ownership requirements. |
| - to attract, retain and reward key employees. We believe a significant portion of executive pay should be aligned with long-term shareholder returns and that encouraging long-term strategic thinking and decision-making requires that corporate officers have a significant stake in the long-term success of Herman Miller. |
| Retirement and Health Benefits | We maintain retirement plans along with a broad base of health insurance plans available to full-time and most part-time employees. | The NEOs participate in such retirement plans and health insurance plans on the same terms as all other employees within their respective geographic region or business unit. |
Compensation Discussion and Analysis (continued)
Compensation Discussion and Analysis (continued) |
| | |
| Other Executive Compensation Plans | We provide limited additional compensation programs to our corporate officers including a compensation protection program in the form of executive long-term disability; a retirement equalization program in the form of a non-qualified retirement match program with an optional deferred compensation element; and in the case of NEOs, a perquisites program with a value of between $20,000 (CEO) and $12,000 (other NEOs) per year. | It is our goal to provide market competitive benefits which allow us to attract and retain critical executive talent. |
The following charts illustrate the key elements of our compensation for our NEOs:
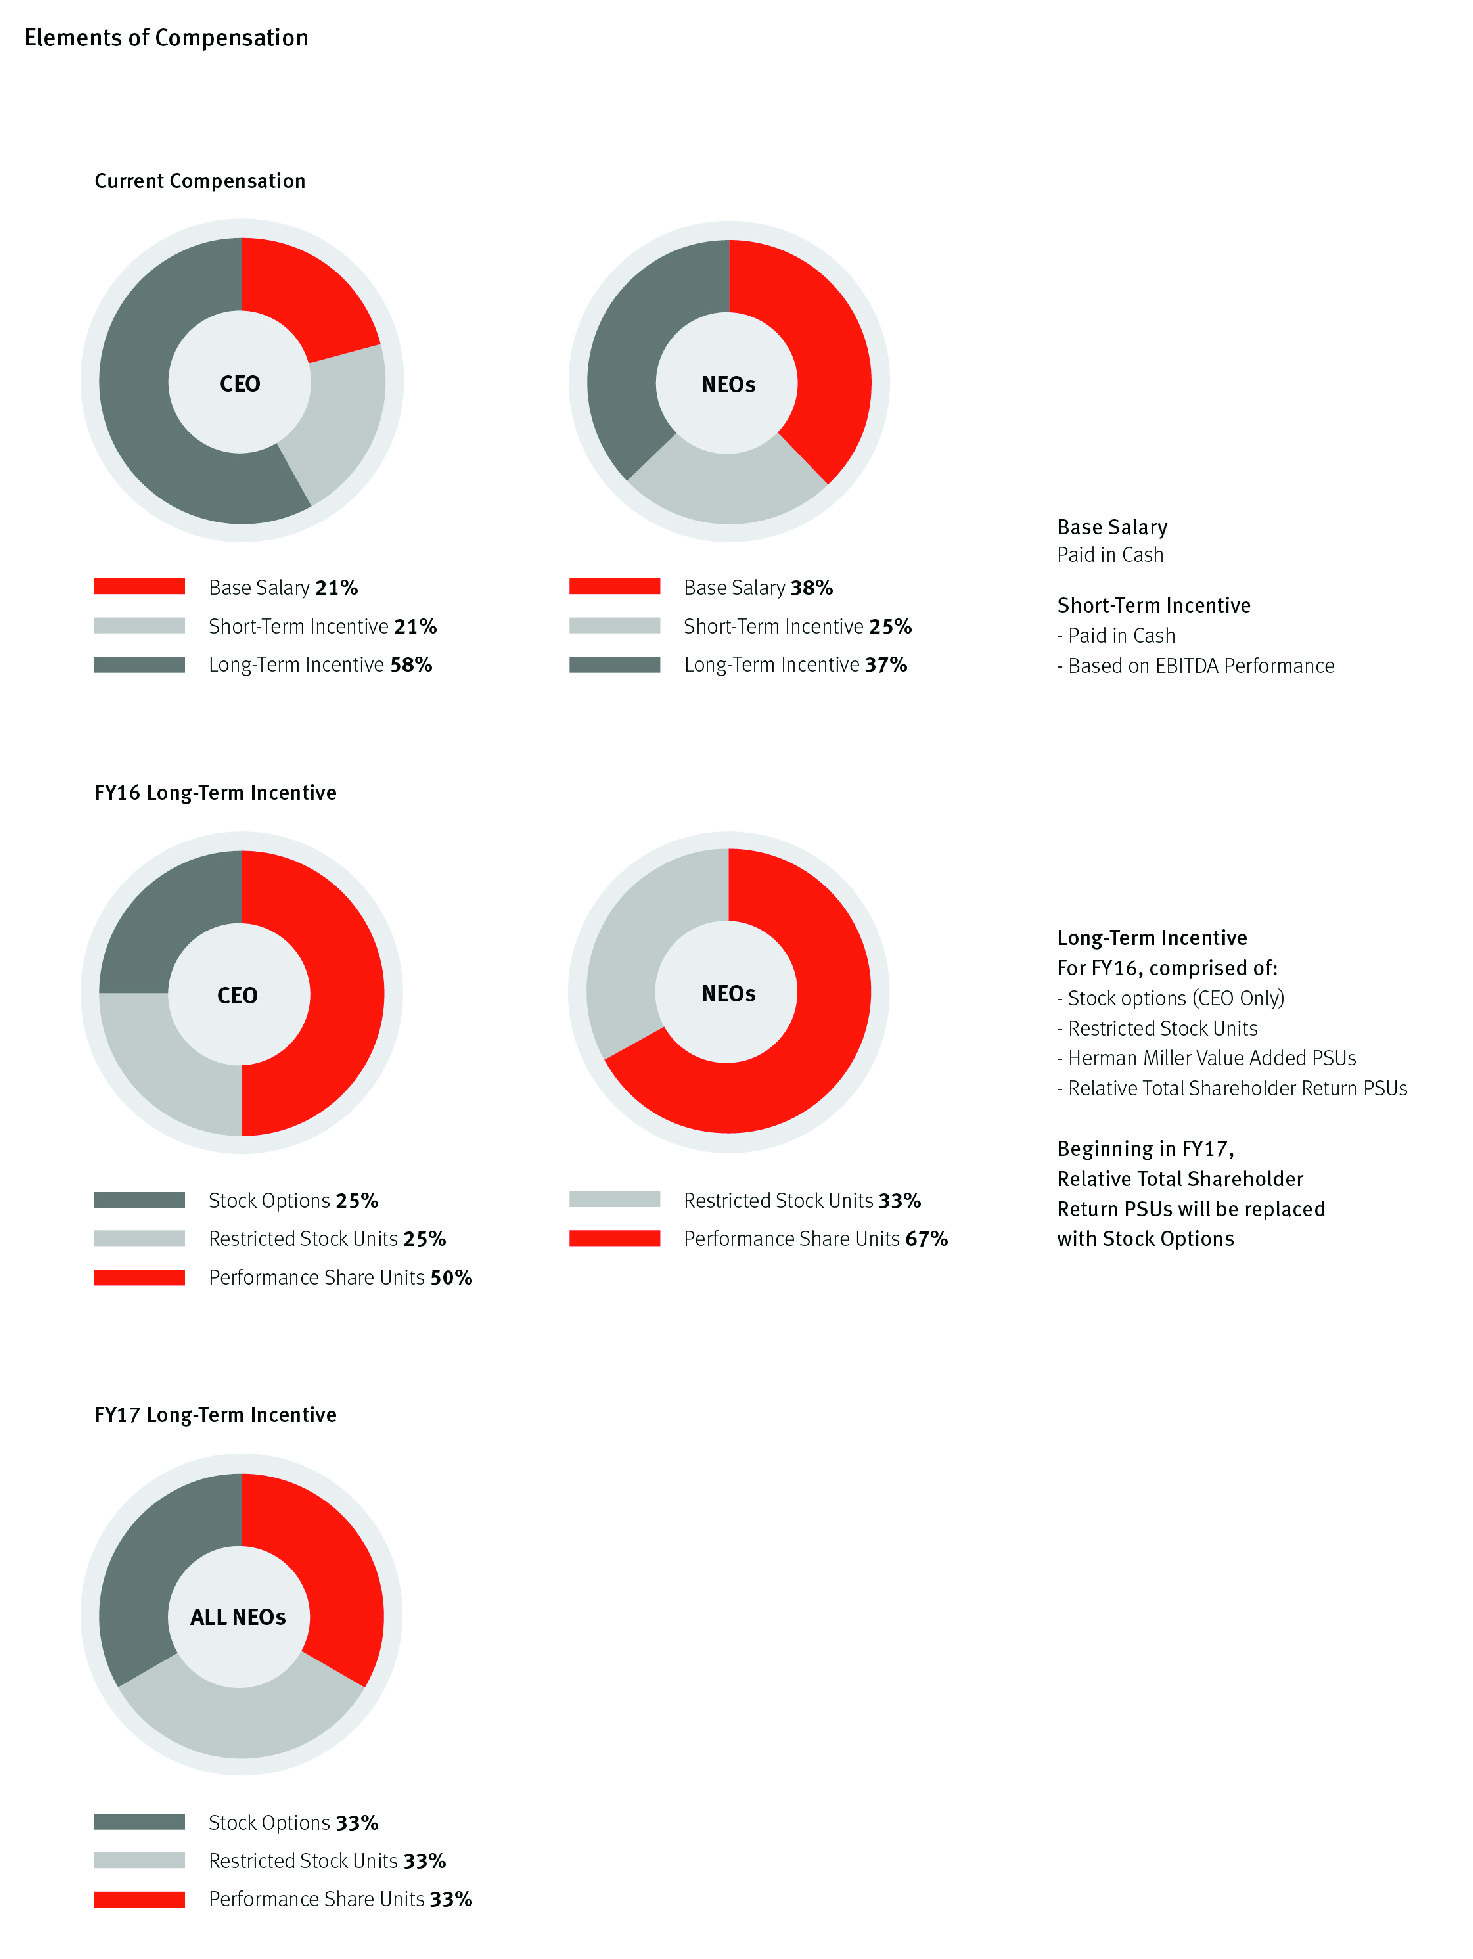
The Committee determined that the total direct compensation (as above described) for each NEO for fiscal year 2016,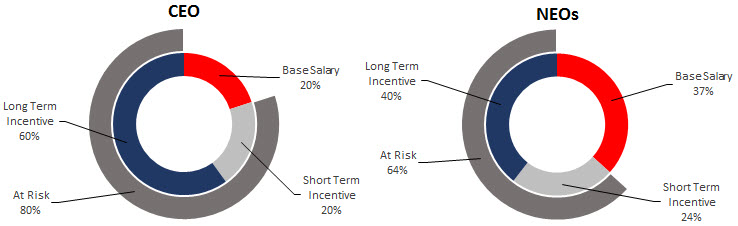
|
|
Base Salary Paid in Cash |
Short-Term Incentive Paid in Cash Based on EBITDA Performance |
FY18 and as approved for fiscal year 2017, is within the benchmarked range given the NEO’s performance, position and the company’s performance.FY19 Long-Term Incentives
Compensation Discussion and Analysis (continued)
The Committee determined that the total direct compensation for each NEO for fiscal 2018, and as approved for fiscal 2019, is within the benchmarked range given each NEO’s performance, position and the company’s performance. We provide more detail regarding each element of compensation for fiscal 2018 in the sections below.
Base Salary in Fiscal 2016
The Committee and the Board granted merit increases for fiscal year 20162018 to our employees, including the NEOs. EachThe base salaries of the base salarieseach of our NEOs was within the range established based on market data for their performance and position. Salary changes went into effect July 13, 201518, 2017 and are detailed as follows:
| | | Name | Salary for Fiscal Year 2016 | Percent Increase | Salary for Fiscal 2018 | Percent Increase |
| Brian C. Walker | $ | 900,000 |
| 2.9 | % | $ | 975,000 |
| 6.0 | % |
| Jeffrey M. Stutz | $ | 350,000 |
| 40.0 | % | $ | 450,000 |
| 12.5 | % |
| Gregory J. Bylsma | $ | 430,000 |
| 5.7 | % | $ | 465,000 |
| 5.7 | % |
| Andrew J. Lock * | $ | 411,000 |
| 3.0 | % | $ | 344,000 |
| 2.7 | % |
| B. Ben Watson | $ | 393,000 |
| 2.1 | % | $ | 430,000 |
| 6.2 | % |
* Measured in pounds sterling at an exchange rate of 1.58661.2794 would yield £259,095.£268,876.
Mr. Walker’s increase reflectsThe Board approved the Board’s continuing recognition of Mr. Walker’s significant contributions to the company’s performance. Mr. Stutz’s increase was a result of his promotion to Executive Vice President and Chief Financial Officer during fiscal year 2015. Mr. Bylsma’s increase was a result of his change in position within the company during fiscal year 2015, which includes new and additional responsibilities. Mr. Lock’s increase was a result of his continued leadership and expansion2018 salary for each of the International business. Mr. Watson’s increase was a resultNEOs based on its review of his continued leadershipmarket data, corporate results and execution of the company’s brand strategy.
Base Salary in Fiscal 2017
The Committee and Board of Directors approved the following changes in the base salaries of the continuing NEOs for fiscal year 2017 as we discuss below:
|
| | | | | |
| Name | Salary for Fiscal Year 2017 | Percent Increase |
| Brian C. Walker | $ | 920,000 |
| 2.2 | % |
| Jeffrey M. Stutz | $ | 400,000 |
| 14.3 | % |
| Gregory J. Bylsma | $ | 440,000 |
| 2.3 | % |
| Andrew J. Lock * | $ | 391,000 |
| 1.0 | % |
| B. Ben Watson | $ | 405,000 |
| 3.1 | % |
* Measured in pounds sterling at an exchange rate of 1.4955 would yield £261,686.
individual performance. Specifically, Mr. Walker’s increase reflects the Board’s recognition of Mr. Walker’s continued efforts to grow the business opportunities for the company. Mr. Stutz’s increase was a result of his continued growth and development in his role, along with his efforts to structure a financial strategy that aligns with the company’s business objectives.objectives and the gap between prior salary and market rates. Mr. Bylsma’s increase is a reflection of his continued improvement of the company’s operations capabilities.capabilities as well as his new responsibility for the overall North America Contract business which includes North America Work, Government, Healthcare and Education businesses. Mr. Lock’s increase is in recognition of putting in placehis implementation of infrastructure to grow the company’s International business. Mr. Watson’s increase is in recognition of the improvement in the company’s brand strategy and messaging, during his tenure as creative director.
Eachnew responsibility for R&D and his new responsibility for streamlining our global portfolio of the base salaries set for the NEOs by the Committee or the Board was within the range established for his performance and position.new products.
Annual Executive Incentive Cash Bonus
Setting Target Bonuses
The Committee, at the beginning of each fiscal year, establishes a target bonus pool representing the amount of Incentive Cash Bonusesincentive bonuses that may be paid under the Annual Executive Cash Incentive Bonus Plan if the company achieves the EBITDA amount contained in the company’s annual financial plan as approved by the Committee and the Board. The Committee also establishes a target bonus for each participant, expressed as a percentage of base salary, which is the targetbonus amount of EBITDA for the company andNEO would receive if all performance goals were achieved at target. The NEOs each have the amount of variation from target EBITDA that would result in either a doublingopportunity to earn up to 200% of the target bonus or noand may earn zero bonus referred to as maximum and minimum threshold performance, respectively.if our goals are not achieved. The target EBITDA and the interval used for maximum and minimum threshold performance are the three points that are used to determine the slope of the bonus factor line. The actual bonus factor paid to an employee represents a point on the line.
The Committee sets the EBITDA targets annually. The Committee also establishes annually any Incentive Cash Bonus targets based upon divisional, functional or operational EBITDA or other goalsannual cash incentive opportunity levels for each participant. The Incentive Cash Bonus earned by participants is expected over time to average 100% of his or her individual target provided the appropriate performance measures are met. The target Incentive Cashour NEOs for 2018, as a percentage of base salary, were as follows:
|
| | | | | |
| Name | Threshold Bonus as % of Base Salary | Target Bonus as % of Base Salary | Maximum Bonus as % of Base Salary |
| Brian C. Walker | 0% | 100% |
| 200% |
|
| Jeffrey M. Stutz | 0% | 65 | % | 130 | % |
| Gregory J. Bylsma | 0% | 65 | % | 130 | % |
| Andrew J. Lock | 0% | 65 | % | 130 | % |
| B. Ben Watson | 0% | 65 | % | 130 | % |
Compensation Discussion and Analysis (continued)
BonusWe set the target incentive bonus percentage for the NEOs generally is set so that the incentive cash bonus at on-targettarget performance will generally equal 100% of the market median bonus amount for comparable positions as shown in the Survey Data,market data, although we may adjust base pay and bonus may be adjusted to maintain total compensation in an amount that is consistent with our compensation philosophy. The Committee believes that this use of Incentive Cash Bonusincentive bonus is consistent with the objective of making compensation for senior Corporate Officerscorporate officers more variable with the company’s performance.
The Committee has adopted guidelines for determining when adjustments to the company’s EBITDA are appropriate in calculating incentive plan performance. Under these guidelines, the Committee will consider whether adjustments are appropriate to best reflect the operating results of our business and appropriately incent management in a manner that is in the best interest of shareholders. Some common examples of potential adjustments under the guidelines include excluding restructuring costs from EBITDA in the period incurred and amortizing them back into the calculation over a five-year period, certain contingent consideration, transaction costs, effects of purchase accounting and income associated with acquisitions. We may exclude these items only in limited circumstances or only for certain periods or specified awards. The guidelines also include a framework for evaluating potential EBITDA adjustments that considers as to a potential item of adjustment:
Whether it is material to the result of the business;
Its impact on near-term cash flows;
Whether it is an accounting adjustment that does not reflect the ongoing operations of the business;
Whether it aligns the company’s performance outlook with long-term shareholder interests;
Whether the adjustment unfairly impacts one particular business unit;
Whether the company has made similar adjustments in recent reporting periods; and
Whether the related income or expense was offset in a prior reporting period (and, if so, if it was excluded from EBITDA).
We intend this framework to be used by management in recommending adjustments and by the Committee in evaluating potential adjustments. The adjustments that we disclose below were based on the Committee’s conclusion that they were consistent with the guidelines.
The Committee is responsible for administering all elements of the Executive Incentive Cash Bonus Plan, except those elements of the plan relating to the CEO (including target percentage payment), which the Board approves. The Committee approves participants in the Plan, the target payment percentage and the plan EBITDA goals. The Audit Committee at the end of each fiscal year approves the calculation of EBITDA results for the year and the EBITDA change from the previous year and the resulting bonus factor. The Committee certifies the use of the bonus factor for use in the Incentive Cash Bonus calculation.
Incentive Cash Bonus for Fiscal 2016
The Committee approved basing a portion of certain NEOs’ incentive cash bonus on functional goals or business unit operating results. The payment target percentages for our CEO and NEOs are listed below. The incentive cash bonuses for Brian Walker and Jeffrey Stutz remained based 100% upon consolidated EBITDA for the entire company. The incentive cash bonus for Andrew Lock, Gregory Bylsma and Ben Watson were based 25% upon the modified EBITDA driven metrics of their respective business units/vertical markets and/or functional goals and 75% upon the consolidated EBITDA. Andrew Lock and Greg Bylsma had Business Unit/Vertical Market goals. Ben Watson had a blend of Business Unit/Vertical Market goals and Functional Goals. The Committee believes that the Incentive Cash Bonus target percentages reflect the appropriate market information provided by the Survey Data and are within the appropriate range for each NEO.
Vertical market EBITDA goals were limited such that they could not exceed 200% of vertical market targeted EBITDA or the blended multiple could not exceed the corporate EBITDA multiple plus 100 basis points. Functional goals were limited such that they could not exceed 200% of the individual Functional Goal target or the blended multiple could not exceed the corporate EBITDA multiple plus 50 basis points.
The Committee believes that the incentive plan calculation should be focused on and reward for EBITDA resulting from operating performance. Therefore, the annual calculation of EBITDA for incentive plan purposes is subject to various adjustments to minimize the impact of non-operating results. The Corporate EBITDA target established by the Committee was $237.0 million with a minimum threshold set at 80% of target ($189.6 million) and a maximum at 120% of the target ($284.4 million).. EBITDA performance below the minimum threshold would result in a payout of 0%, EBITDA performance at the target threshold would result in a payout of 100% and EBITDA performance at or above the maximum threshold would result in a payout of 200% of the eligible bonus dollars.
For fiscal year 2016, the company’s actual EBITDA (as adjusted in the manner described in the table below) was $257.7 million, which was between the target amount of $237.0 million (100%) and the maximum amount of $284.4 million (200%). Interpolating the relative position of the company’s actual adjusted EBITDA along the payout slope line yielded a payout percentage of approximately 144% of the target value for the fiscal year. For fiscal year 2016, the company’s EBITDA performance for incentive plan purposes has been adjusted to reflect the following items (refer to the section “Reconciliation of Non-GAAP Measures” on page 54 for further information):
Compensation Discussion and Analysis (continued)
|
| | |
Description | Adjustment to EBITDA
($ millions)
| Rationale for the Adjustment |
1. Amortization of previously excluded restructuring | $(0.8) | Board approved restructuring actions are not included in the calculation of adjusted EBITDA to help ensure management’s near-term compensation goals are not in conflict with the long-term strategic objectives of the business. Instead, related costs are amortized over a 5 year period and such amortization will be included in the calculation. |
2. Gain recognized in connection with the sale of a former U.K. manufacturing facility | $(4.0) | The Committee determined it is reasonable to exclude this gain from the calculation on the basis that it does not reflect the ongoing operation of the business. |
3. Gain recognized in connection with the divestiture of Australia dealership | $(2.1) | The Committee determined it is reasonable to exclude this gain from the calculation on the basis that it does not reflect the ongoing operation of the business. |
The Committee is responsible for setting performance goals for our annual incentive bonuses for each of our NEOs, other than our CEO, whose goals the full Board sets. For fiscal 2018, we based each NEO’s annual incentive bonus on our 2018 consolidated EBITDA results. Messrs. Bylsma, Lock and Watson also had a portion of their compensation based on functional goals and/or business unit operating results. Specifically, for fiscal 2018, the table below illustrates the portion of each NEO’s bonus that is tied to corporate and functional or business unit goals.
The Committee and Board review the adjustments, and in certain instances the Committee and/or the Board decides whether certain adjustments should apply to the bonus calculations for specific participants. Based on this reviewconsolidated Corporate EBITDA target for fiscal year 2016,2018, which would result in 100% payout of the Committee determined that Andrew Lock,EBITDA portion of the annual incentive bonus, was $269.0 million. Achieving 113% of the EBITDA target ($304.0 million) would result in his role as Presidenta 200% payout of Herman Miller International,the eligible bonus payout, and anything below 94.4% of the target EBITDA ($254.0 million) would result in no payout. The maximum payout for the portion of our NEOs’ bonuses based on functional goals or business unit EBITDA was instrumentalalso limited to 200%.
2018 Performance Results and Bonus Payouts
For fiscal 2018, the company’s actual EBITDA (as adjusted in the realizationmanner we describe below) was $266.4 million, which was between the target amount of $269.0 million (100%) and the minimum amount of $254.0 million (0%) and resulted in a payout percentage of approximately 93% of the gain related totarget value for the sale of the Australia dealership. Accordingly, the Committee included the gain for purposes of calculating the business unit performance component of his annual bonus.
fiscal year. The EBITDA bonus amounts awardedwe paid to the NEOs were as follows:
| | | Name | Target Bonus Percent Tied to Company EBITDA |
Company Performance Factor | Bonus Earned For Company Performance |
Target Bonus Percent tied to Function/Bus Unit |
Function/ Bus Unit Performance Factor | Bonus Earned For Function/Bus Unit Performance |
Total Bonus Amount Paid |
Bonus Amount Deferred(1) | Target Bonus Percent Tied to Company EBITDA |
Company Performance Factor | Bonus Earned For Company Performance |
Target Bonus Percent tied to Function/Bus Unit |
Function/ Bus Unit Performance Factor | Bonus Earned For Function/Bus Unit Performance |
Total Bonus Amount Paid |
Bonus Amount Deferred (1) |
| Brian C. Walker | 100.00 | % | 1.4364 |
| $ | 1,287,926 |
| | | | $ | 1,287,926 |
| $ | 103,034 |
| 100.00 | % | 0.9253 |
| $ | 894,142 |
| | | | $ | 894,142 |
| $ | 71,531 |
|
| Jeffrey M. Stutz | 65.00 | % | 1.4364 |
| $ | 314,226 |
| | | $ | 314,226 |
| $ | 9,427 |
| 65.00 | % | 0.9253 |
| $ | 265,888 |
| | | $ | 265,888 |
| $ | 26,589 |
|
| Gregory J. Bylsma | 48.75 | % | 1.4364 |
| $ | 298,918 |
| 16.25 | % | 2.0000 |
| $ | 138,744 |
| $ | 437,662 |
| $ | 43,766 |
| 32.50 | % | 0.9253 |
| $ | 138,160 |
| 32.50 | % | 0.8761 |
| $ | 131,263 |
| $ | 269,423 |
| $ | 26,990 |
|
| Andrew J. Lock | 48.75 | % | 1.4364 |
| $ | 271,303 |
| 16.25 | % | 1.2004 |
| $ | 75,596 |
| $ | 346,899 |
| $ | — |
| 32.50 | % | 0.9253 |
| $ | 108,635 |
| 32.50 | % | 2.0000 |
| $ | 234,829 |
| $ | 343,464 |
| |
B. Ben Watson(2) | 48.75 | % | 1.4364 |
| $ | 274,424 |
| 16.25 | % | 1.2554 |
| $ | 79,953 |
| $ | 354,377 |
| $ | 21,263 |
| 48.75 | % | 0.9253 |
| $ | 192,195 |
| 16.25 | % | 1.0000 |
| $ | 69,234 |
| $ | 261,429 |
| $ | 26,143 |
|
(1) - This amount represents the portion of histhe bonus that the NEO elected to defer under the Herman Miller, Inc. Executive Equalization Retirement Plan described later in this Compensation Discussion and Analysis.
(2) - Mr. Watson's Function/Business Unit Performance Factor is a blend
Prior to payout of 8.13% Business Unit (bonusthe bonuses, the Audit Committee approves the calculation of EBITDA results for the year and the resulting company performance factor. The Committee also certifies the company performance factor of 1.3007) and 8.13% Functional (bonus factor of 1.2100).the function/business unit performance factors for use in the Incentive bonus calculation.
Incentive Cash Bonus for Fiscal 2017
For fiscal year 2017, the measure of achievement under the Executive Incentive Cash Bonus Plan continues to be EBITDA. The Corporate EBITDA target established by the Committee is $278.0 million with a minimum threshold set at $236.3 million and maximum at $333.6 million. Other provisions of the fiscal year 2017 plan, such as the use of functional and business unit goals, are the same as the fiscal year 2016 plan described above.
Long-Term Equity Incentives
Setting Target LTI Values
For each NEO, the Committee calculates a target value of LTI grants for the current fiscal year that is expressed as a percentage of base salary and determines the percent of the target LTI value that should be allocated to each award type. The Committee sets the total target value of the LTI grants for each NEO at a level intended to ensure that the NEO’s total direct compensation would correspond with the market median of the market data for a comparable NEO’s individual position. Following the end of the fiscal year, the Committee determines the total value of LTI grants for each NEO based on each NEO’s target value and the company’s financial performance for that year relative to target. We convert that value for each NEO into grants of restricted stock units and performance share units based on the closing price of our stock on the date of grant and grants of stock options using a Black-Scholes valuation on the date of grant, using the share price on the date of grant as the exercise price.
Grants Awarded in Fiscal 2018
The table below illustrates the target value of the LTI grants, expressed as a percentage of their base salary, to our NEOs that the Committee and Board established and granted in July 2017. The target values associated with these grants were allocated approximately equally among the following three award types: RSUs, Herman Miller Value Added Performance Share Units and stock options.
The following table discloses the types of awards granted in July 2017 (fiscal 2018). It does not include grants of restricted stock units that we awarded to the NEOs (excluding Brian Walker) in connection with the retention agreements discussed in the paragraph entitled "Retention Agreements" later in this Compensation Discussion and Analysis. Those units are disclosed in the "Grants of Plan-Based Awards" table.
Compensation Discussion and Analysis (continued)
|
| | | | | | | | | | | |
| Name | Target of LTI as a % of Salary | Restricted Stock Units | Herman Miller Value Added Performance Share Units | Number of Options | Option Exercise Price |
| Brian C. Walker | 300 | % | 27,259 |
| 27,259 |
| 143,975 |
| $ | 33.75 |
|
| Jeffrey M. Stutz | 110 | % | 4,346 |
| 4,346 |
| 22,953 |
| 33.75 |
|
| Gregory J. Bylsma | 125 | % | 5,432 |
| 5,432 |
| 28,691 |
| 33.75 |
|
| Andrew J. Lock | 95 | % | 3,145 |
| 3,145 |
| 16,611 |
| 33.75 |
|
| B. Ben Watson | 80 | % | 3,200 |
| 3,200 |
| 16,901 |
| 33.75 |
|
Key Features of Each Award
Restricted Stock Units: The restricted stock units (RSU) represent the right to receive shares of Herman Miller, Inc. common stock. Each unit represents the equivalent of one share of the common stock as of the date of grant and cliff vests after three years. RSUs convert into shares upon vesting. Dividends are not paid over the vesting period but accrue on the RSUs and are added to the total value of the units at the time of vesting.
Herman Miller Value Added Performance Share Units: The Herman Miller value added performance share units are units representing the right to receive shares of Herman Miller, Inc. at the end of the specified performance period. These units cliff vest after three years if certain Herman Miller Value Added goals are met. The awards provide that the total number of shares that finally vest may vary between 0 and 200% of thenumber of units awarded depending upon performance relative to the established Herman Miller Value Added goal. The Committee establishes the Herman Miller Value Added goals at the start of each three-year performance period. The awards also provide the Committee the ability to extend the performance period to a total of five years; however, if the extension is granted, then no more than 34% of the target grant may vest. Units convert into shares upon vesting. Dividends do not accrue on the awards.
Herman Miller Value Added is defined as the company’s annual earnings before interest, taxes, depreciation and amortization (EBITDA) (excluding non-controlling ownership interests) less a capital charge. The capital charge for each cycle is determined by multiplying the company’s capital by its cost of capital. The Committee approves the determination of the cost of capital and EBITDA for purposes of the Herman Miller Value Added Performance Share Units.
For grants made in fiscal 2018, the Value-Added goals are as follows:
|
| |
| Payout % of Target | 2018 - 2020 Average Value Added |
| 200% of Target PSUs | $230 million or more |
| 100% of Target PSUs | $210 million |
| No PSUs Earned | Below $183 million |
| Capital Charge | 10% |
Stock Options: The options vest ratably over three years and have a ten-year life, and the exercise price of each option equals the fair market value of our stock on the date of grant. In fiscal 2018, we granted stock options to all NEOs.
Details of our Executive Compensation Program
Role of the Committee
The Committee consists of three directors, each qualifying as independent under NASDAQ’s listing requirements. The Board has determined that each member of the Committee also meets the definition of independence under our corporate governance guidelines and qualifies as a non-employee director for purposes of Rule 16b-3 under the Securities Exchange Act of 1934.
The Committee’s primary functions are to oversee the compensation philosophy and strategy, to determine or recommend the compensation of company officers, including the NEOs, and to act as the Administrative Committee for our executive compensation and broad-based equity and benefit plans.
Compensation Discussion and Analysis (continued)
The Committee is also responsible for providing recommendations to the full Board with respect to all aspects of the annual compensation of our President and CEO. In addition, the Committee, based upon recommendations from our CEO, approves the annual compensation for all other officers covered by Section 16 of the Securities Exchange Act of 1934 including the NEOs and other corporate officers. Our President and CEO establishes the base salary of all other executives.
Among other responsibilities, the Committee establishes the performance objectives for the Annual Executive Incentive Cash Bonus Plan and our equity-based compensation plans, which cover the President and CEO, NEOs, other corporate officers and other executive employees.
The Committee is also tasked to review and advise on the compensation philosophy and strategy of the company, review and approve compensation and benefit plans as required by the Committee Charter, and review the annual compensation plans’ risk analysis.
Role of the External Compensation Consultants
The Committee has the authority and sole discretion to select independent compensation consultants, legal consultants and other advisors to provide it independent advice. During July of fiscal 2018, the Committee retained Pay Governance LLC as its independent compensation consultants with respect to the compensation matters regarding our corporate officers. Prior to that time, Pearl Meyer & Partners served as the Committee's independent compensation consultant, including advisory services related to compensation of corporate officers for fiscal 2018. The independent services that Pearl Meyer provided to the Committee included reviewing the elements of compensation of the President and CEO as well as the other corporate officers and comparing those elements to our compensation philosophy and objectives and to market practices. We do not permit Pearl Meyer or Pay Governance to provide other consulting services to the company.
Pearl Meyer concluded that our compensation program established for those officers is consistent with our compensation philosophy and objectives as well as with market practices. With the approval of the Committee, we retained Meridian Compensation Partners LLC in fiscal 2018 to provide marketplace compensation data and compensation consulting services to management for employees other than the corporate officers.
Benchmarking of Compensation
To ensure that executive compensation is competitive, the Committee uses marketplace compensation data to compare our compensation program to market pay practices. The Committee, in determining fiscal 2018 compensation, also used a specific peer group for benchmarking pay (we list the members of the peer group in the Additional Compensation Information, Peer Group section later in this Compensation Discussion and Analysis). This peer group included both direct competitors as well as comparable companies in other industries to reflect the competitive market for talent in which we compete.
Pearl Meyer used the peer group information along with the following survey sources when analyzing the fiscal 2018 market competitiveness of pay levels of corporate officers: Willis Towers Watson Executive Compensation Database, Aon Hewitt Executive Total Compensation Measurement Database, Mercer Executive Database and Equilar Insight Database (we refer to the peer group information and these survey sources collectively as “market data”). We use the market data to determine competitiveness of base pay, annual incentive and long-term incentive awards. Pearl Meyer uses a regression analysis and aging to make allowances for time differences in the data and to align the data so that it is representative of companies having revenues equivalent to the operations that our individual corporate officers manage. Pearl Meyer compared the base salary, target total cash and target total direct compensation of each corporate officer to the 25th, 50th (market median) and 75th percentile of the Market Data for a comparable benchmark position.
Pearl Meyer provided the Committee with benchmarking data, market practices and trends, peer group selection and pay for performance evaluation information to provide appropriate context for the Committee’s deliberations. Our CEO made recommendations to the Committee regarding the compensation package for each of the corporate officers (other than himself). The CEO based his recommendations with respect to corporate officers on the Pearl Meyer information, his evaluation of the individual’s performance, the company’s performance and other factors. The Committee based its approval of the CEO’s recommendations for the compensation of corporate officers (other than the CEO) on the Committee’s review of the information from Pearl Meyer relative to market pay, advice from Pearl Meyer and the Committee members’ own judgment, including their judgment on the relative performance of both the company and its corporate officers. Based upon these same factors relative to the CEO's performance, the Committee made a recommendation to the full Board for the CEO’s compensation. The Board of Directors determines the compensation of the CEO and the CEO did not participate in any conversations about his own compensation.
Compensation Discussion and Analysis (continued)
The Committee reviews and approves the peer group that we use in benchmarking compensation on an annual basis. The peers that we used for fiscal 2018 are set forth below:
|
| | |
| Aaron's Inc. | HNI Corporation | Lennox International, Inc. |
| Acuity Brands, Inc. | Interface, Inc. | Polaris Industries, Inc. |
| Belden Inc. | Kimball International, Inc. | Restoration Hardware Holdings, Inc. |
| Brunswick Corporation | Knoll, Inc. | Select Comfort Corporation |
| Ethan Allen Interiors, Inc. | La-Z-Boy, Inc. | Steelcase, Inc. |
| Hill-Rom Holdings, Inc. | Leggett & Platt, Inc. | Tempur-Pedic International, Inc. |
During fiscal 2018, after we had already set executive compensation for 2018, the Committee worked with Pay Governance to revise our peer group. We are using this revised peer group when setting executive compensation for fiscal year 2019. The revised peer group is set forth below:
|
| | |
| American Woodmark Corporation | JELD-WEN Holdings, Inc. | RH aka Restoration Hardware Holdings, Inc. |
| Armstrong World Industries, Inc. | Kimball International, Inc. | Sleep Number Corporation |
| Ethan Allen Interiors, Inc. | Knoll, Inc. | Steelcase, Inc. |
| Hill-Rom Holdings, Inc. | La-Z-Boy, Inc. | Tempur Sealy International, Inc. |
| HNI Corporation | Leggett & Platt, Inc. | Universal Forest Products, Inc. |
| Interface, Inc. | Masonite International Corporation | Williams-Sonoma, Inc. |
Our peer group is intended to represent companies against which we may compete for talent, with an emphasis on a number of criteria. For fiscal 2019, we made a number of changes to the peer group in light of these criteria: We removed Aaron’s, Acuity Brands, Belden, Brunswick, Lennox International and Polaris because of differences in industry and customer focus. We replaced these six companies with American Woodmark, Armstrong World Industries, JELD-WEN, Masonite, Universal Forest Products and Williams Sonoma which better meet our selection criteria and enable us to maintain a peer group of robust size.
EBITDA Adjustments
The Committee has adopted guidelines for determining when adjustments to the company’s EBITDA are appropriate in calculating incentive plan performance. Under these guidelines, the Committee will consider whether adjustments are appropriate to best reflect the operating results of our business and appropriately incent management in a manner that is in the best interest of shareholders. Some common examples of potential adjustments under the guidelines include excluding restructuring costs from EBITDA in the period incurred and amortizing them back into the calculation over a five-year period, certain contingent consideration, transaction costs, effects of purchase accounting and income associated with acquisitions. We may exclude these items only in limited circumstances or only for certain periods or specified awards. The guidelines also include a framework for evaluating potential EBITDA adjustments that considers as to a potential item of adjustment:
Whether it is material to the result of the business;
Its impact on near-term cash flows;
Whether it is an accounting adjustment that does not reflect the ongoing operations of the business;
Whether it aligns the company’s performance outlook with long-term shareholder interests;
Whether the adjustment unfairly impacts one particular business unit;
Whether the company has made similar adjustments in recent reporting periods; and
Whether the related income or expense was offset in a prior reporting period (and, if so, if it was excluded from EBITDA).
For fiscal 2018, company EBITDA performance was adjusted for incentive plan purposes to reflect the following items (refer to the section “Reconciliation of Non-GAAP Measures” for further information):
Compensation Discussion and Analysis (continued)
|
| | |
| Description | Adjustment to EBITDA ($ millions) | Rationale for the Adjustment |
| 1. Amortization of previously excluded restructuring | $(1.9) | Board approved restructuring actions are not included in the calculation of adjusted EBITDA to help ensure management’s near-term compensation goals are not in conflict with the long-term strategic objectives of the business. Instead, related costs are amortized over a 5-year period and such amortization will be included in the calculation. |
| 2. Current year pre-tax restructuring expense | $8.2 | Board approved restructuring actions are not included in the calculation of adjusted EBITDA to help ensure management’s near-term compensation goals are not in conflict with the long-term strategic objectives of the business. Instead, these costs will be amortized over a 5-year period and such amortization will be included in the EBITDA calculation. |
| 3. Third party consulting costs related to profit optimization plans, net of amortization | $4.8 | The Committee determined it is appropriate to exclude from the calculation of EBITDA the third party consulting costs associated with the company's profit optimization plans for the Consumer and North America business segments to help ensure management’s near-term compensation goals are not in conflict with the long-term strategic objectives of the business. Instead, related costs are amortized against EBITDA as the savings from the initiatives are realized on a dollar-for-dollar basis. |
| 4. Costs associated with the CEO transition plan announced in February 2018 | $4.4 | The Committee determined it is appropriate to exclude the costs associated with the CEO transition plan announced in February 2018 as the costs are not reflective of the ongoing operation of the business. |
Long-Term Equity Incentives
Our 2011 Long-Term Incentive Plan (which we refer to as the LTI Plan) authorizes us to grant various forms of equity-based compensation (which we refer to as Long-Term Incentive Grants or LTI grants or awards). The Committee is responsible for administering all elements of the LTI Plan and for making all Long-Term Incentive Grants, with the exception of the CEO whose grants the Board approves.
Compensation Discussion and Analysis (continued)
Historically, the Committee has established targets relating to Long-Term Incentive awards at the beginning of each fiscal year (during the month of July offor that fiscal year) and made actual grants of awards during the month of July following the end of the fiscal year taking into accountconsidering the company’s financial performance for that year. Typically, the Committee and the Board at their June and July meetings take four actions in connection with our LTI Plan: (a) set the target value for the LTI awards for the current fiscal year, (b) determine the types of awards to be used for the current fiscal year, (c) establish the performance criteria, if any, for certain awards for the current fiscal yearyear; and (d) grant the long-term incentive awards for the just completed fiscal year based upon the company’s performance relative to target.
For each NEO, the Committee calculates a target value of LTI grants for the current fiscal year that is expressed as a percentage of base salary. The Committee sets the total target value of the LTI grants for each of these NEOs at a level intended to ensure that the NEO’s total direct compensation would correspond with the market median of the Survey Data for a comparable NEO’s individual position. Following the end of the fiscal year, the Committee determines the total value of LTI grants for each of these NEOs based on each NEO’s target value and the company’s financial performance for that year relative to target. We convert that value for each NEO into grants of Restricted Stock Units, Herman Miller Value Added Performance Share Units, Relative TSR Performance Share Unit Awards and/or Stock Options. For this conversion, we value each Restricted Stock Unit and Herman Miller Value Added Performance Share Unit at an amount equal to the closing price of our stock on the date of grant. We value each Relative TSR Performance Share unit using the Monte Carlo valuation model. We value each stock option through the use of the Black Scholes valuation model.
The key features of each award are as follows:
Restricted Stock Units: The restricted stock units (RSU) consist of units representing the right to receive shares of Herman Miller, Inc. common stock. Each unit represents the equivalent of one share of the common stock as of the date of grant and cliff vests after three years. RSUs convert into shares after they vest. Dividends accrue on the RSUs and are added to the total value of the units at the time of vesting.
Herman Miller Value Added Performance Share Units: The Herman Miller value added performance share units are units representing the right to receive shares of Herman Miller, Inc. at the end of the specified performance period. These units cliff vest after three years if certain Herman Miller Value Added tests are met. The awards provide that the total number of shares that finally vest may vary between 0 and 200% of the number of units awarded depending upon performance relative to the established Herman Miller Value Added goal. The Committee establishes the Herman Miller Value Added goals. The Herman Miller Value Added goal for on target vesting is a 3 year average. The awards also grant the Committee the ability to extend the performance period to a total of five years; however, if the extension is granted, then no more than 34% of the target grant may vest. Units convert into shares after they vest. Dividends do not accrue on the awards.
Herman Miller Value Added is defined as the company’s annual earnings before interest, taxes, depreciation and amortization (EBITDA) (excluding non-controlling ownership interests) less a capital charge. The capital charge is determined annually by multiplying the company’s capital by its cost of capital. The determination of the cost of capital and EBITDA for purposes of the Herman Miller Value Added Performance Share Units is approved by the Committee.
For grants made in fiscal 2016 and fiscal 2017, the Value Added goals are as follows:
|
| | |
| Payout % of Target | 2016 - 2018 Average Value Added | 2017 - 2019 Average Value Added |
| 200% of Target PSUs | $193 million or more | $239 million or more |
| 100% of Target PSUs | $170 million | $210 million |
| No PSUs Earned | Below $154 million | Below $191 million |
| Capital Charge | 10% | 10.0% |
Relative TSR Performance Share Units: Relative TSR Performance Share Unit Awards are units representing the right to receive shares of Herman Miller, Inc. at the end of the specified performance period. These units cliff vest after three years if we meet certain total shareholder return (TSR) objectives. The awards provide that the total number of shares that finally vest may vary between 0 and 200% of the number of units awarded depending upon performance relative to established total shareholder return goals, with the award amount vesting if performance is at the target level. The Committee establishes the goals.
Compensation Discussion and Analysis (continued)
TSR is the total shareholder return to Herman Miller shareholders including reinvested dividends and share price changes that occur during a fiscal year. We determine TSR performance by comparing the company’s TSR to a peer group of companies. The peer group of companies for fiscal year 2016 is the same as the peer group that we use for purposes of benchmarking NEO compensation, and those companies are listed in the Additional Compensation Information, Peer Group section later in this Compensation Discussion and Analysis.
For Relative TSR Performance Share Units that we granted in fiscal year 2016, vesting is based on the relative performance as follows:
|
| |
Payout % of Target | 3-year Average Relative TSR |
200% of Target PSUs | 80th percentile or greater |
100% of Target PSUs | 50th percentile
|
No PSUs Earned | Below 25th percentile
|
Stock Options: The options vest ratably over three years and have a ten year life, and the exercise price of each option equals the fair market value of our stock on the date of grant. In fiscal year 2016, we granted stock options only to the CEO. In fiscal year 2017, we granted stock options to all of the NEOs as we discuss below.
In June and July 2016 (fiscal year 2017), the Committee approved two changes impacting LTI grants:
First, the Committee elected to grant options in lieu of Relative TSR Performance Share Units to all of the NEOs, commencing with the LTI grants in July 2016 (fiscal year 2017) relating to fiscal year 2016. The Committee concluded that stock options provide greater clarity and simplicity compared to Relative TSR Performance Share Unit Awards. Stock options provide value to the recipient only if the price of the stock increases after the grant date, and the Committee therefore intends that option grants will provide an additional incentive to increase the underlying stock price.
Second, the Committee approved imposing a cap on the total value of LTI grants effective with the grants that the Committee will approve in July 2017 to tie the aggregate cost of LTI grants to the company’s ability to maintain and grow EBITDA. The cap will equal 4.5% of the preceding fiscal year’s EBITDA. Of the available amount, 0.5% of the preceding fiscal year’s EBITDA will be available for LTI grants to be used by the CEO for discretionary awards. If the amount of LTI grants that the Committee would otherwise make based upon target awards and actual results exceeds the cap based on the preceding fiscal year’s EBITDA, then the Committee will reduce actual grant sizes pro rata.
Tax Deductibility of Restricted Stock Units
In June 2015, the Committee created a pool of shares from which the 2016 RSU awards to selected participants could be made provided that certain operating results are achieved. The Committee retained the authority to award less than the full value of the pool even if the performance targets were met. The provisions of this arrangement are intended to meet the requirements of Internal Revenue Code section 162(m) for the deductibility of certain compensation. The value of equity awards that could be made from the pool with respect to performance during fiscal year 2016 was limited to a maximum $5,000,000 with the requirement that we needed to achieve $4,000,000 of operating income after taking the charge for those awards and that the grants given to any individual could not exceed 30% of the pool. The participants in the pool were the Corporate Officers. The results we achieved in fiscal year 2016 permitted granting of awards having the $5,000,000 maximum value.
For fiscal year 2017 RSU grants, the Committee created a pool of shares using the same guidelines as fiscal year 2016.
LTI Grants Awarded in Fiscal 2016
The target value of the LTI grants that the Committee and Board established for our NEOs (including all types) in July 2014 for final grants to occur in July 2015 based on fiscal year 2015 performance as a percent of base salary was 280% for Brian Walker, 50% for Jeffrey M. Stutz, 120% for Gregory Bylsma, 95% for Andrew Lock and 75% for Ben Watson. The total target value was allocated approximately equally among the award types that we intended to grant to each NEO. The Committee decided that our CEO would receive all four types of LTI awards, while our other NEOs would receive only three types of awards: RSUs, Herman Miller Value Added Performance Share Units and Relative TSR Performance Share Units. The Committee chose to award stock options as an additional award type to our CEO because the Committee desired to provide our CEO with an additional incentive to execute strategies that drive increased shareholder value, and it believed that stock options were well-suited for this purpose. The Committee chose to grant our CEO all four types of LTI awards, rather than options only, to ensure that our CEO would have a balance of incentives rather than having an incentive tied solely to increasing our stock price.
Compensation Discussion and Analysis (continued)
The following table discloses the types of awards granted in July 2015 (fiscal year 2016) based upon fiscal year 2015 performance:
|
| | | | | | | | | | | |
| Name | Restricted Stock Units | Herman Miller Value Added Performance Share Units | Relative TSR Performance Share Units | Number of Options | Option Exercise Price |
| Brian C. Walker | 21,099 |
| 21,099 |
| 17,466 |
| 91,070 |
| $ | 29.03 |
|
| Jeffrey M. Stutz | 1,435 |
| 1,435 |
| 1,118 |
| | |
| Gregory J. Bylsma | 5,608 |
| 5,608 |
| 4,642 |
| | |
| Andrew J. Lock | 4,355 |
| 4,355 |
| 3,605 |
| | |
| B. Ben Watson | 3,316 |
| 3,316 |
| 2,745 |
| | |
LTI Grants Awarded in Fiscal 2017
The target value of the LTI grants that the Committee and Board established for our NEOs (including all types) in July 2015 for final grants to occur in July 2016 based on fiscal year 2016 performance as a percent of base salary was 280% for Brian Walker, 100% for Jeffrey Stutz, 125% for Gregory Bylsma, 95% for Andrew Lock, and 75% for Ben Watson. The total target value was allocated approximately equally among the award types that we intended to grant to each NEO. The Committee originally determined that our CEO would receive all four types of LTI awards, while our other NEOs would receive only three types of awards: RSUs, Herman Miller Value Added Performance Share Units and Relative TSR Performance Share Units.
Subsequently, as discussed above, the Committee elected to grant options in lieu of Relative TSR Performance Share Units to all of the NEOs, commencing with the LTI grants in July 2016 (fiscal year 2017) relating to fiscal year 2016. In fiscal year 2017, stock option grants will be made in the same proportion as were the Relative TSR Performance Share Unit Awards (1/3).
The following table discloses the types of awards granted in July 2016 (fiscal year 2017) based upon fiscal year 2016 performance:
|
| | | | | | | | | |
| Name | Restricted Stock Units | Herman Miller Value Added Performance Share Units | Number of Options | Option Exercise Price |
| Brian Walker | 26,365 |
| 26,365 |
| 152,614 |
| $ | 31.86 |
|
| Jeffrey Stutz | 3,662 |
| 3,662 |
| 21,196 |
| 31.86 |
|
| Gregory Bylsma | 5,624 |
| 5,624 |
| 32,551 |
| 31.86 |
|
| Andrew Lock | 3,851 |
| 3,851 |
| 22,292 |
| 31.86 |
|
| B. Ben Watson | 3,084 |
| 3,084 |
| 17,850 |
| $ | 31.86 |
|
In July 2015 (fiscal year 2016), the Committee and the Board also approved a special award of conditional stock options to our executive leadership team, including the NEOs, that was conditioned on achievement of one-year performance objectives in fiscal year 2016. We based the number of shares subject to the special award granted to each recipient at the end of the one-year performance period upon the relative achievement of sales and EBITDA performance objectives for fiscal year 2016, as well as targeted EBITDA as a percent of sales for the upcoming fiscal year (fiscal year 2017), which is established by the CEO and management, and approved by the Committee as part of the company’s annual fiscal planning process starting in January and continuing through June. Each of these performance objectives was weighted equally. The actual number of shares that would be subject to each option grant would vary based upon performance relative to the special award objectives, the targeted value for each NEO and the value of our stock at the end of fiscal year 2016. The options vest ratably over a three year period following the date of grant, the exercise price was the fair market value of our stock as of the date of the grant ($31.86), and each option has a term of 10 years. The Committee made the special awards to provide an additional incentive for the executive leadership team to drive further growth across the Company’s business. The Committee determined the amount of the special award to each executive on the basis of the Committee’s view of the relative impact of the executive to the improvement in the Company’s business. The Committee made the final special option awards in July 2016 (fiscal year 2017). The target and actual results for fiscal year 2016 sales and EBITDA and the target and actual targeted EBITDA growth for fiscal year 2017 as well as the target award value and options awarded for each NEO are set forth in the below tables.
Compensation Discussion and Analysis (continued)
|
| | | | | | |
| Components (Dollars in 000) | Target | Actual |
| FY 16 Sales Plan | $ | 2,242.0 |
| $ | 2,264.9 |
|
| FY 16 EBITDA Plan | $ | 237.0 |
| $ | 257.7 |
|
| FY 17 Plan EBITDA as a % of Sales | 11.6 | % | 11.7 | % |
|
| | | | | | |
| Name | Targeted Value | Options Awarded |
| Brian Walker | $ | 400,000 |
| $ | 72,673 |
|
| Jeffrey Stutz | $ | 200,000 |
| $ | 36,337 |
|
| Gregory Bylsma | $ | 200,000 |
| $ | 36,337 |
|
| Andrew Lock | $ | 150,000 |
| $ | 27,252 |
|
| B. Ben Watson | $ | 125,000 |
| $ | 22,710 |
|
Practices Concerning Grant Dates
Grants under the LTI Plan are typically made in connection with the Board of Directors meeting in July of each year following the public release of our fiscal year-end financial results. We do not attempt to influence the amount of executive compensation by timing equity grants in connection with the disclosure of material information to the public. The backdating of equity award dates is specifically prohibited under policies adopted by the Board of Directors.
Other Considerations
Tally Sheet Review
In June 2017, the Committee reviewed executive compensation tally sheets that Pearl Meyer provided with respect to each corporate officer which reflected the total direct compensation to the NEOs and also information relating to all other elements of compensation including payments under severance or change in control obligations. The Committee uses this information to help it determine that our compensation program is consistent with market norms and with our compensation philosophy and the objectives referenced above.
Compensation Discussion and Analysis (continued)
Impact of Prior Compensation. Prior compensation of the NEOs does not normally impact how the Committee sets the current elements of compensation. The Committee believes the current competitive environment is more relevant in determining an NEO’s current total level of compensation. As described above, the Committee uses tally sheets to track all elements of current compensation. The Committee, however, has the ability to consider the impact of any special equity grants upon the value of future grants that we make to corporate officers under the 2011 Long-Term Incentive Plan.
Retirement and Health Benefits
Health Plans
We maintain a broad basebroad-base of health insurance plans available to all full-time and most part-time employees. The NEOs participate in such health insurance plans on the same terms as all other employees within their respective geographic region or business unit.
Retirement Plans
We maintain broad basedbroad-based retirement plans available for employees in the United States and the United Kingdom (UK). Our retirement plans are designed to provide an appropriate level of replacement income upon retirement. The benefits available to NEOs are the same as those available to other non-executive employees in their respective geographic region subject to limitations provided by law or regulation.
The retirement plans include:
The Herman Miller, Inc. Profit Sharing and 401(k) Plan
The Herman Miller Limited Retirement Benefits Plan (UK)
Profit Sharing Plan and 401(k) Plan: The Herman Miller, Inc. Profit Sharing and 401(k) Plan consists of threetwo parts. We annuallyFirst, we make a core contribution to the profit sharing portion based upon our EBITDA results for the year that may range from 0%an employee’s 401(k) account equal to 6%4% of base salaries, withsalary on a target contribution of 3% of base salary. Based upon our EBITDA results, the actual percentage contributed for fiscal year 2016 was 4.31%.quarterly basis. The amount of salary included in the base for the calculation is limited to the maximum salary level permitted by the IRS. We also make a 4% core contribution to an employee’s 401(k) account on a quarterly basis. TheSecond, the 401(k) portion of the plan is apermits employees to make salary deferral plan. Each employee may elect to deferdeferrals into the plan up to the maximum amount permitted by law. We also make a matching contribution to fully match employee contributions up to 3%4% of the employee’s compensation contributed.
contribution.
Herman Miller Limited Retirement Plan: Herman Miller Limited, our wholly owned UK subsidiary, provides a defined contribution retirement plan which provides for a non-discretionary fixed company contribution and a company matching contribution. The fixed company contribution for employees varies between 2.4% and 6.4% of the employee’s eligible compensation depending upon age and date of hire. In addition, the company will match an employee’s contributions up to an additional 2.8% of eligible compensation. Andrew Lock is the only NEO who participates in this defined contribution retirement plan. He is also a participant in the frozen defined benefit plan sponsored by Herman Miller Limited for employees hired prior to March 1, 2012.
Compensation Discussion and Analysis (continued)
Other Executive Compensation Plans
Deferred Compensation Plan
The Herman Miller, Inc. Executive Equalization Retirement Plan was approved by the Committee and the Board in 2007. The plan is a supplemental deferred compensation plan and became available for salary deferrals beginning in January 2008. The plan is available to highly compensated United States employees who are selected for participation by the Committee. All of the NEOs are currently able to participate, except Andrew Lock due to his employment outside the United States. The plan allows participants to defer up to 50% of their base salary and 100% of their Incentive Cash Bonus. Companyincentive bonus. company contributions to the plan “mirror” the amounts we would have contributed to the Herman Miller Profit Sharing and 401(k) Plan had the employee’s compensation not been above the statutory ceiling (currently $265,000)$275,000). Investment options under this plan are the same as those available under the 401(k) Plan except forPlan. company stock which is not an investment option under this plan. Company contributions for amounts deferred in fiscal year 20162018 appear in the 20162018 Summary Compensation Table under All Other Compensation.
Executive Long-Term Disability Plan
The plan covers 60% of the rolling two yeartwo-year average of executive incentive compensation. Corporate Officersofficers are eligible to participate when they have earned over $6,000 in annual executive incentive compensation. This benefit continues as long as the executive isremains disabled until age 65. The monthly benefit is capped at $10,000.
Compensation Discussion and Analysis (continued)
Perquisites
We are conservative in our approach to executive perquisite benefits. Company compensation practices in general do not provide for personal perquisites and the Committee has adopted a policy which specifically restricts the use of corporate aircraft for non-business purposes. We provide a limited number of perquisites to Corporate Officers.corporate officers. We normally provide each NEO with a specified dollar amount which can be used for a rangevariety of approved perquisites. These perquisites include financial planning, life insurance, spousal travel and other benefits. The 2016Committee has adopted a policy that specifically restricts the use of corporate aircraft for non-business purposes. The 2018 calendar year benefit isperquisite maximum was $20,000 for the CEO and $12,000 for each of the other NEOs, except for the CFO for whom the benefit is $6,000.NEOs. Unspent allowances may be carried over into the next calendar year provided an executive continues to participate in the program.this benefit. The total maximum allowance (new calendar year allowance plus amount carried over) may not exceed the sum of reimbursement allowances approved for the prior two calendar years.
In addition to the above perquisite allowances, in fiscal year 2016,2018, we also provided the NEOs and all other Corporate Officerscorporate officers with the opportunity to obtain comprehensive physicals at our cost.
Additional Retirement, Retention, and Change in Control Agreements
Mr. Brian C. Walker’s Retirement
As we have previously disclosed, Mr. Walker announced his intention to retire from his position with the company by August 31, 2018. In connection with his retirement, Mr. Walker agreed to extend his post-employment non-compete and non-solicitation covenants from 12 to 18 months and to an unlimited confidential information and non-disparagement covenant. He also agreed to be available on a consultative basis for 18-months after his retirement to help with the transition to the new CEO and specifically to provide the new CEO with guidance and back- ground on our unique “contract” furniture business. In exchange for agreeing to extend his post-employment non-compete and non-solicitation covenants and to provide consulting services for up to 18 months, we agreed to pay Mr. Walker his base salary for an additional six months. Because Mr. Walker was already entitled to 12 months of base salary in exchange for his original 12 months of non-compete and non-solicitation covenants, he will receive base salary continuation for a total of 18 months following his retirement. We also agreed to provide Mr. Walker with a lump sum payment equal to 18 months of the employer portion of the premiums for his health and dental benefits. In the unlikely event Mr. Walker resigns prior to the identification of the new President and CEO of the company or is terminated for cause prior to August 31, 2018, he will not receive any of these payments. Given his retirement, the Committee determined that Mr. Walker would not be eligible for any equity compensation grants for fiscal 2019 or for a 2019 annual incentive opportunity.
Retention Agreements
Recognizing that the transition to a new CEO creates a period of uncertainty for our other employees, the Committee approved retention agreements for certain key executives, including our NEOs (other than the CEO), in February 2018. These agreements, which were intended to ensure the executives’ commitment to the company while we search for a new CEO, provide the following benefits:
A retention bonus equal to the executive’s actual annual bonus for fiscal 2018. The retention bonus will be payable in two equal installments on (a) the date the fiscal 2018 annual incentives are payable and (b) as part of the last payroll in December 2018, provided the executive remains employed on those dates and, in the discretion of the Board, a successful transition of the CEO position from Mr. Walker to the new CEO has occurred.
A grant of restricted stock units with a value equal to the executive’s base salary, which we granted in February 2018. Such restricted stock units will vest on the second anniversary of the grant date provided the executive remains employed on that date. These units are disclosed in the "Grants of Plan-Based Awards" table.
However, if we terminate the executive’s employment without cause or the executive elects to cease employment with the company for good reason prior to payment of the retention bonus or vesting of the RSUs, then the executive will continue to be eligible to receive the retention bonus and his or her RSUs will automatically vest if he or she signs and does not revoke a general release of claims. If no release is signed, the executive forfeits the retention bonus.
As we also previously disclosed, on March 2, 2018, Mr. Lock announced his intent to retire, and did so retire, effective July 31, 2018. As a result, Mr. Lock will receive a prorated (up to July 31,018) value of his restricted stock and will only receive 50% of the retention bonus, in accordance with the terms of his agreement described above. Mr. Lock has agreed to provide consulting services to our new President of International for 12 months following his retirement for no additional compensation.
Compensation InformationDiscussion and Analysis (continued)
Change in Control Agreements
Each NEO is party to a change in control agreement with us. The Committee believes that the use of change in control agreements is appropriate as they help ensure a continuity of management during a threatenedpossible take-over and help ensure that management remains focused on completing a transaction that is likely to maximize shareholder value. Potential payments under the change in control agreements are included in the tally sheets provided annually tothat the Committee.Committee reviews annually.
The narrative and footnotes to the tables entitled Potential Payments upon Termination, in Connection with aDeath, Disability, Retirement or Change in Control describe the change in control payments in greater detail.
Deductibility of Compensation Program Changes for Fiscal 2019
The income tax lawsfollowing is a summary of changes that our Committee and Board of Directors have made to our executive compensation program for fiscal 2019 as of the United States (Section 162(m)) limit the amount we may deduct for compensation paid to our CEO and the other three most highly-paid Corporate Officers (other than the CFO). Under Section 162(m) compensation that qualifies as “performance based” is not subject todate of this limit. It is generally our intention to qualify compensation payments for tax deductibility under Section 162(m). Notwithstanding our intentions, because of ambiguities and uncertainties as to the application and interpretation of Section 162(m) and the regulations issued thereunder, no assurance can be given that compensation intended to satisfy the requirements for deductibility under Section 162(m) will so qualify.proxy statement.
In addition,Base Salary in Fiscal 2019
The Committee and Board of Directors approved the following changes in the base salaries of the continuing NEOs for fiscal 2019 as we discuss below:
|
| | | | | |
| Name | Salary for Fiscal 2019 | Percent Increase |
| Brian C. Walker | $ | — |
| — | % |
| Jeffrey M. Stutz | $ | 480,000 |
| 6.7 | % |
| Gregory J. Bylsma | $ | 480,000 |
| 3.2 | % |
| Andrew J. Lock | $ | — |
| — | % |
| B. Ben Watson | $ | 445,000 |
| 3.5 | % |
The Committee reservesdecided not to increase Mr. Walker’s compensation in light of his impending retirement. Mr. Stutz's increase is the rightresult of his proficient performance in his role having completed a full three years in 2018 as CFO particularly in light of complexities in the global financial environment. Mr. Bylsma’s increase is a reflection of his continued improvement of the company’s operations capabilities as well as his new responsibility for the overall North America Contract business which includes North America Work, Government, Healthcare and Education businesses. Mr. Lock has no increase due to provide compensation that does not qualify ashis retirement on July 31, 2018. Mr. Watson’s increase is in recognition of the improvement in the company’s brand strategy and messaging, his new responsibility for R&D and his new responsibility for streamlining our global portfolio of new products.
Each of the base salaries set for the NEOs was within the range established for his performance based compensationand position.
Incentive Cash Bonus for Fiscal 2019
For fiscal 2019, the measure of achievement under Section 162(m)the Executive Incentive Cash Bonus Plan continues to be EBITDA. For fiscal 2019 awards, we are eliminating the extent it believes such compensation is necessary or appropriate to continue to provide competitive arrangements intended to attract and retain, and provide appropriate incentives to, Corporate Officersfunction goals for Mr. Watson and other key employees.functional leaders, such that their 2019 annual incentive bonus will be based 100% on corporate EBITDA. Other provisions of the fiscal 2019 plan, such as the use of business unit goals, are the same as the fiscal 2018 plan. As discussed above, Mr. Walker is not eligible for a 2019 annual incentive bonus given that he is retiring by August 31, 2018.
LTI Grants Awarded in Fiscal 2019
The Committee approved several changes to our LTI grants for fiscal 2019. First, based on feedback we received from shareholders during fiscal 2018, we decided to add to our fiscal 2019 LTI mix for our executive leadership team performance share units that vest based on our TSR relative to our peer group. For fiscal 2019, applicable executives (including NEOs) received a mix of relative TSR performance share units, Herman Miller Value-Added performance share units, restricted stock units, and stock options, each making up 25% of the total LTI grant value.
Compensation Discussion and Analysis (continued)
The target levels for the relative TSR performance share unit payouts are as follows:
|
| |
| Relative TSR Performance Percentile Compared to Peers | Payout % of Target |
80th percentile or greater | 200% |
65th percentile | 150% |
50th percentile = target performance | 100% |
40th percentile | 75% |
30th percentile = minimum performance | 50% |
Below 30th percentile | 0% |
Second, we eliminated the share pool concept for fiscal 2019. The share pool was intended to allow all of our LTI awards to be fully deductible under Section 162(m) as performance-based compensation, but given the elimination of the performance-based exception under 162(m) due to the Tax Cuts and Jobs Act, the pool is no longer relevant. (See the discussion under the heading “Deductibility of Compensation” below for more information.)
The target value of the LTI grants that the Committee and Board established for our NEOs (including all types) in July 2017 for final grants to occur in July 2018 (fiscal 2019) based on fiscal 2018 performance as a percent of base salary was 125% for Jeffrey Stutz and Gregory Bylsma and 90% for Ben Watson. The total target value was allocated approximately equaling among the award types that we granted to each NEO: RSUs, Herman Miller Value Added Performance Share Units, Relative Total Shareholder Return Performance Share Units and stock options. Mr. Walker is not eligible to receive a fiscal 2019 LTI award due to his retirement effective August 21, 2018.
The following table discloses the types of awards granted in July 2018 (fiscal 2019) based upon fiscal 2018 performance:
|
| | | | | | | | | | |
| Name | Restricted Stock Units | Herman Miller Value Added Performance Share Units | Relative Total Shareholder Return Performance Share Units | Number of Options | Option Exercise Price |
| Brian C. Walker | — |
| — |
| — |
| — |
| — |
|
| Jeffrey M. Stutz | 3,672 |
| 3,672 |
| 2,633 |
| 17,512 |
| $38.30 |
| Gregory J. Bylsma | 3,794 |
| 3,794 |
| 2,721 |
| 18,096 |
| $38.30 |
| Andrew J. Lock | — |
| — |
| — |
| — |
| — |
|
| B. Ben Watson | 2,526 |
| 2,526 |
| 1,812 |
| 12,049 |
| $38.30 |
Hedging Policy
The Committee and the Board of Directors hashave adopted a policy prohibiting the Board of Directors and the Corporate Officerscorporate officers from hedging the economic risk of their ownership of our stock, including options or other derivatives related to the stock.
Impact of Prior Compensation in Setting Elements of Compensation
Prior compensation of the NEOs does not normally impact how the Committee sets the current elements of compensation. The Committee believes the current competitive environment is more relevant in determining an NEO’s current total level of compensation. As described earlier the Committee uses tally sheets to track all of the elements of current compensation to enable the Committee to determine whether the compensation which the NEO is currently receiving is consistent with market practices. The Committee, however, has the ability to consider the impact of any special equity grants upon the value of future grants made to Corporate Officers under the LTI Plan.
Impact of Restatements Retroactively Impacting Financial Goals
We have not had any material restatement of prior financial results. If such restatements were to occur, the Committee would review the matter and determine what, if any, adjustment to current compensation might be appropriate. The LTI Plan and the Executive Incentive Bonus Plan give the Committee the right to “claw back” Incentive Cash Bonus payments and LTI grants in the event of certain restatements.
Peer Group
The peer group that we use in both benchmarking compensation and for measuring performance for the relative TSR comparison for our Relative TSR Performance Share Units is reviewed and approved by the Committee on an annual basis. The peers that we used for fiscal year 2016 are set forth below and include Restoration Hardware Holdings, Inc., which was added during fiscal year 2016:
|
| | |
Aaron's Inc. | HNI Corporation | Lennox International, Inc. |
Acuity Brands, Inc. | Interface, Inc. | Polaris Industries, Inc. |
Belden Inc. | Kimball International, Inc. | Restoration Hardware Holdings, Inc. |
Brunswick Corporation | Knoll, Inc. | Select Comfort Corporation |
Ethan Allen Interiors, Inc. | La-Z-Boy, Inc. | Steelcase, Inc. |
Hill-Rom Holdings, Inc. | Leggett & Platt, Inc. | Tempur-Pedic International, Inc. |
Post−Employment Compensation
Change in control and discharge for other than cause can result in additional compensation being paid to or for certain NEOs. In addition, as described above, certain of the Long-Term Incentive Bonus payments continue if the NEO leaves employment as the result of death, disability or retirement.
Stock Ownership Guidelines
The Committee believes that significant stock ownership by top management is of critical importance to our ongoing success, as it helps link the interests of senior management and our shareholders. StockAs such, we have established stock ownership requirementsguidelines, which apply to the nine members of the executive leadership team and, beginning January 1, 2018, certain other corporate officers who work alongside the Executive Leadership Team; who are requiredTeam to ensure global strategic alignment across business units and functions. The stock ownership guidelines require these individuals to own shares of our common stock equal to a specified multiple of their annual base salary. The applicable levels are as follows:
President and Chief Executive Officer 6 times base salary
Corporate Officersofficers with LTIP target equal to or greater than 100% of salary 4 times base salary
Certain other direct reports to the CEO 3 times base salary
Other corporate officers 1 times base salary
Compensation Discussion and Analysis (continued)
Stock Retention Requirements
Until the executive meets the ownership guidelines are met, the executive must retain 40% of the pretax spread value of vested restricted stock, performance shares, restricted stock units, deferred stock, and 40% of the pretax spread value of exercised stock options must be retained in company stock. Compliance with the requirements is determined at each time an executive disposes of company stock.
Tally Sheet ReviewIncentive Clawback
We have not had any material restatement of prior financial results. If such restatements were to occur, the Committee would review the matter and determine what, if any, adjustment to current compensation might be appropriate. The LTI Plan and the Annual Executive Incentive Cash Bonus Plan give the Committee reviewed executivethe ability to “claw back” incentive bonus payments and LTI grants in the event of certain restatements.
Deductibility of Compensation
Section 162(m) of the Internal Revenue Code generally disallows a tax deduction to public corporations for compensation tally sheets provided by Pearl Meyer with respectin excess of $1 million paid for any fiscal year to each Corporate Officer which reflectedindividuals who are covered executives. For compensation paid for fiscal 2018, our covered executives were limited to our CEO and our other three most highly compensated corporate officers for that year, other than our CFO. However, for compensation that we paid for fiscal 2018, Section 162(m) generally exempted compensation that qualified as “performance based” from the total direct$1 million deduction limit. It was generally our intention that the compensation we paid to our covered executives for fiscal 2018 was deductible under Section 162(m) of the Code. Despite our intentions, because of ambiguities and uncertainties as to the NEOsapplication and also information relatinginterpretation of Section 162(m) and the regulations issued under that section, we cannot assure that compensation we intend to allsatisfy the requirements for deductibility under Section
162(m) will so qualify. In addition, the Committee reserved the right to provide compensation during fiscal 2018 that did not qualify as performance-based compensation under Section 162(m) to the extent it believed such compensation was necessary or appropriate to continue to provide competitive arrangements intended to attract and retain, and provide appropriate incentives to, corporate officers and other elements of compensation including payments under severance or change in control obligations. The Committee uses this information to help it determine that our compensation program is consistent with market norms andkey employees.
Starting with our fiscal 2019, as a result of changes made to the applicability of Section 162(m) of the Code pursuant to the Tax Cuts and Jobs Act, our number of covered executives will expand to include our covered executives for 2018 plus any executive who, starting with fiscal 2019, serves as our CEO or CFO, or who is among the three most highly compensated executive officers, for any fiscal year. In addition, only qualifying performance-based compensation philosophythat is paid pursuant to a binding contract in effect on November 2, 2017 will be exempt from the deduction limit. Accordingly, any compensation that we pay in the future pursuant to new compensation arrangements entered into after November 2, 2017, even if performance-based, will count towards the $1 million fiscal year deduction limit if paid to a covered executive. Because of these changes to Code Section 162(m) by the Tax Cuts and Jobs Act, some of the objectives referenced above.compensation that we provide to our named executive officers in 2019 and future years may not be deductible under Section 162(m).
Post-Employment Compensation Discussion and Analysis (continued)
Termination and Retention Payments
The NEOs are generally “at will” employees. This means that they can be discharged at any time and for no reason. We have agreed to pay Corporate Officerscorporate officers severance if they are terminated for reasons other than malfeasance or voluntary separation. For each NEO, severance would be equal to 18 months of base salary subject to the employee not competing with us during that period. The Committee’s determination as to the amount of severance payments for these NEOs is the result of benchmarking our practices to the Published SurveyMarket Data. In addition, we maintain the health insurance on such employee during the salary continuation period. In exchange for such payments the employee provides the company with a mutual release of all claims and agrees not to work for a competitor or solicit our employees during the salary continuation period.
Executive Compensation Committee Report
The Committee has reviewed and discussed the Compensation Discussion and Analysis required by Item 402(b) of Regulation S-K with Management and, based on such review and discussions, the Committee recommended to the Board that the Compensation Discussion and Analysis be included in the Proxy Statement.
|
| | |
| J. Barry Griswell (chair) | David Brandon | John R. Hoke III |
Summary Compensation Table
The summary compensation table below shows the compensation for the NEOs for the fiscal years ended June 2, 2018 (2018), June 3, 2017 (2017) and May 28, 2016 (2016), May 30, 2015 (2015) and May 31, 2014 (2014). The details of the Company'scompany's executive compensation programsprogram are found in the Compensation Discussion and Analysis (or CD&A.&A) above.
| | Name and Principal Position
| Year | Salary ($) |
| Stock Awards ($)(1) |
| Option Awards ($)(1) |
| Non-Equity Incentive Plan Compensation ($)(2) |
| Change in Pension Value and Nonqualified Deferred Compensation Earnings ($)(3) |
| All Other Compensation ($)(4) |
| Total ($) |
| Year | Salary ($) |
| Stock Awards ($)(1) |
| Option Awards ($)(1) |
| Non-Equity Incentive Plan Compensation ($)(2) |
| Change in Pension Value and Nonqualified Deferred Compensation Earnings ($)(3) |
| All Other Compensation ($)(4) |
| Total ($) |
|
| Brian C. Walker | 2016 | 896,635 |
| 1,800,797 |
| 612,500 |
| 1,287,926 |
| | 116,742 |
| 4,714,600 |
| 2018 | 966,327 |
| 1,782,466 |
| 920,000 |
| 894,142 |
| | 165,106 |
| 4,728,041 |
|
| President and Chief Executive Officer | 2015 | 870,289 |
| 1,731,868 |
| 587,998 |
| 440,714 |
| | 150,142 |
| 3,781,011 |
| 2017 | 916,846 |
| 1,626,984 |
| 1,240,002 |
| 684,059 |
| | 233,597 |
| 4,701,488 |
|
| | 2014 | 834,616 |
| 1,474,217 |
| 499,998 |
| 748,149 |
| 29,798 |
| 134,425 |
| 3,721,203 |
| 2016 | 896,635 |
| 1,800,797 |
| 612,500 |
| 1,287,926 |
| | 116,742 |
| 4,714,600 |
|
| Jeffrey M. Stutz | 2016 | 336,538 |
| 122,480 |
| | 314,226 |
| | 11,432 |
| 784,676 |
| 2018 | 442,116 |
| 734,197 |
| 146,670 |
| 265,888 |
| | 40,183 |
| 1,629,054 |
|
| EVP and Chief Financial Officer | 2015 | 249,327 |
| 96,210 |
| | 80,882 |
| | 7,997 |
| 434,416 |
| |
| Executive Vice President and Chief | | 2017 | 392,115 |
| 225,982 |
| 316,667 |
| 190,176 |
| | 57,383 |
| 1,182,323 |
|
| Financial Officer | | 2016 | 336,538 |
| 122,480 |
| | 314,226 |
| | 11,432 |
| 784,676 |
|
| Gregory J. Bylsma | 2016 | 426,904 |
| 478,629 |
| | 437,662 |
| | 42,984 |
| 1,386,179 |
| 2018 | 461,058 |
| 820,191 |
| 183,335 |
| 269,903 |
| | 49,080 |
| 1,783,567 |
|
| EVP and Chief Operating Officer, | 2015 | 405,385 |
| 445,968 |
| | 170,951 |
| | 48,453 |
| 1,070,757 |
| |
| Herman Miller Work and Learning | 2014 | 392,308 |
| 368,540 |
| | 228,598 |
| 14,854 |
| 53,655 |
| 1,057,955 |
| |
| President, North America Contract | | 2017 | 438,423 |
| 347,057 |
| 379,166 |
| 214,257 |
| | 83,616 |
| 1,462,519 |
|
| | | 2016 | 426,904 |
| 478,629 |
| | 437,662 |
| | 42,984 |
| 1,386,179 |
|
Andrew J. Lock(5) | 2016 | 386,188 |
| 371,695 |
| | 346,899 |
| 59,521 |
| 90,709 |
| 1,255,012 |
| 2018 | 360,062 |
| 549,812 |
| 106,144 |
| 343,464 |
| 12,882 |
| 207,131 |
| 1,579,495 |
|
| EVP and President, Herman Miller | 2015 | 398,054 |
| 349,624 |
| | 203,047 |
| 200,388 |
| 146,387 |
| 1,297,500 |
| |
| International | 2014 | 394,435 |
| 276,513 |
| | 172,900 |
| 110,486 |
| 98,014 |
| 1,052,348 |
| |
| President, Herman Miller International | | 2017 | 334,713 |
| 237,645 |
| 272,695 |
| 230,863 |
| 144,700 |
| 205,312 |
| 1,425,928 |
|
| | | 2016 | 386,188 |
| 371,695 |
| | 346,899 |
| 59,521 |
| 90,709 |
| 1,255,012 |
|
| B. Ben Watson | 2016 | 391,923 |
| 283,019 |
| | 354,377 |
| | 60,450 |
| 1,089,769 |
| 2018 | 426,058 |
| 639,249 |
| 107,997 |
| 261,429 |
| | 40,737 |
| 1,475,470 |
|
| Executive Creative Director | | |
|
| |
| Chief Creative Officer | | 2017 | 403,108 |
| 190,314 |
| 223,246 |
| 227,474 |
| | 66,257 |
| 1,110,399 |
|
| | | 2016 | 391,923 |
| 283,019 |
| | 354,377 |
| | 60,450 |
| 1,089,769 |
|
| |
| (1) | For all NEOs, amounts represent the aggregate grant date fair value of stock awards and option awards computed in accordance with FASB ASC Topic 718. The assumptions used in calculating these amounts are set forth in Note 9 of the Company'scompany's consolidated financial statements for the fiscal year ended May 28, 2016June 2, 2018 included in our Annual Report on Form 10-K. |
| |
| (2) | Includes the amounts earned in fiscal 20162018 and paid in fiscal 20172019 under the Executive Incentive Cash Bonus Plan as described in the Compensation Discussion and Analysis for the NEOs. Certain executives have elected to defer a part of the bonus under the Key Executive Deferred Compensation Plan. The amount of the deferrals and the corresponding Companycompany contributions will be shown in next year's Nonqualified Deferred Compensation Table. |
| |
| (3) | Amounts represent the aggregate change in the actuarial present value of the accumulated benefits under the Company'scompany's Retirement Plans. |
| |
| (4) | The amounts for fiscal 20162018 for all other compensation are described in the table below. |
| |
| (5) | All amounts reported for Mr. Lock were paid to him in British pounds sterling. The U.S. dollar value of the amounts paid to him for the fiscal year ended May 28, 20162018 is calculated based on the average annual conversion rate for fiscal 2016 -2018 of £1=$1.4955.1.34303. |
| | | | Bundled Benefits(a) |
| Car allowance (UK only) |
| Payment in lieu of Pension Contribution |
| Dividends on restricted stock | Long-term Disability Insurance |
| Vesting of Registrants contributions to Deferred Compensation Plan | Nonqualified Deferred Compensation Contribution(b) |
| Total Other Compensation |
| Bundled Benefits(a) |
| Car allowance (UK only) |
| Payment in lieu of Pension Contribution |
| Long-term Disability Insurance |
| Nonqualified Deferred Compensation Contribution(b) |
| Total Other Compensation |
|
| Brian C. Walker | 19,435 |
| | | 2,809 |
| | 94,498 |
| 116,742 |
| 26,383 |
| | 3,888 |
| 134,835 |
| 165,106 |
|
| Jeffrey M. Stutz | 518 |
| | | 903 |
| | 10,011 |
| 11,432 |
| 3,889 |
| | 2,417 |
| 33,877 |
| 40,183 |
|
| Gregory J. Bylsma | 11,643 |
| | | 2,657 |
| | 28,684 |
| 42,984 |
| 6,281 |
| | 3,435 |
| 39,364 |
| 49,080 |
|
Andrew J. Lock(c) | 5,677 |
| 13,370 |
| 71,662 |
| | | |
| 90,709 |
| 33,679 |
| 12,007 |
| 161,445 |
| |
| 207,131 |
|
| B. Ben Watson | 31,997 |
| | | 2,578 |
| | 25,875 |
| 60,450 |
| | 3,543 |
| 37,194 |
| 40,737 |
|
| |
| (a) | Bundled Benefits are provided on a calendar year basis and include accounting fees, cell phone fees, club dues, family travel, education and training, home office expenses, vehicle expenses, and life insurance. Benefits for Mr. WatsonWalker include the approved amount for calendar 20162018 plus carryover for calendar years 20152017 and 2014.2016. |
| |
| (b) | Amounts represent the Company'scompany's contribution to the Herman Miller, Inc. Executive Equalization Retirement Plan. |
| |
| (c) | Mr. Lock serves the company through its United Kingdom subsidiary. As such, his benefits are paid according to the benefits paid in the United Kingdom, which are different from the benefits in the United States. His benefits include medical insurance, car allowance, spouse travel, and contributions to a pension plan. All amounts are converted from GBP to USD at the average annual conversion rate for fiscal 2016 -2018 of £1=$1.4955.1.34303. |
Grants of Plan-Based Awards
The GrantGrants of Plan-Based Awards table below sets forth information on equity awards granted by the Companycompany to the NEOs during fiscal 20162018 under the Long TermLong-Term Incentive Plan (LTI Plan) and the possible payouts to the NEOs under the Annual Executive Incentive Cash Bonus Plan (Annual Cash Bonus Plan) for fiscal 2015.2017. The Compensation Discussion and Analysis provides further details of grants under the LTI Plan, as well as the performance criteria under the Annual Cash Bonus Plan. (The LTI grants are discussed in the CD&A under the heading LTILong-Term Equity Incentives Grants Awarded in Fiscal 2016)2018).
| | | Name | Grant Date | Estimated Possible Payouts Under Non-Equity Incentive Plan Awards(1) | | | Estimated Future Payouts Under Equity Incentive Plan Awards (2) | | | | Grant Date | Estimated Possible Payouts Under Non-Equity Incentive Plan Awards(1) | | | Estimated Future Payouts Under Equity Incentive Plan Awards (2) | | | |
| | | | | | | | All Other Stock Awards: Number of Shares of Stock or Units (#)(3) |
| All Other Option Awards: Number of Securities Underlying Options (#)(4) |
| Exercise or Base Price of Option Awards ($/Sh)(5) |
| Grant Date Fair Value of Stock and Option Awards ($)(6) |
| | | | | | | All Other Stock Awards: Number of Shares of Stock or Units (#)(3) |
| All Other Option Awards: Number of Securities Underlying Options (#)(4) |
| Exercise or Base Price of Option Awards ($/Sh)(5) |
| Grant Date Fair Value of Stock and Option Awards ($)(6) |
|
| | | Threshold ($) |
| Target ($) |
| Maximum ($) |
| | Threshold (#) | Target (#) |
| Maximum (#) |
| | | Threshold ($) |
| Target ($) |
| Maximum ($) |
| | Threshold (#) | Target (#) |
| Maximum (#) |
| |
| Brian C. Walker | 07/13/15 | | | 0 | 21,099 |
| 42,198 |
| | | 575,792 |
| 07/18/17 | | | 0 | 27,259 |
| 54,518 |
| | | 862,475 |
|
| | 07/13/15 | | | 0 | 17,466 |
| 34,932 |
| | | 612,501 |
| 07/18/17 | | | |
| | 27,259 |
| | 919,991 |
|
| | 07/13/15 | | | | | 21,099 |
| | 612,504 |
| 07/18/17 | | | | | | 143,975 |
| 33.75 |
| 920,000 |
|
| | 07/13/15 | | | | | | 91,070 |
| 29.03 |
| 612,500 |
| | 0 |
| 966,327 |
| 1,932,654 |
| | | | |
|
| Jeffrey M. Stutz | | 07/18/17 | | | 0 | 4,346 |
| 8,692 |
| | | 137,507 |
|
| | | 0 |
| 896,635 |
| 1,793,270 |
| | | | |
| 07/18/17 | | | |
| | 4,346 |
| | 146,678 |
|
| Jeffrey M. Stutz | 07/13/15 | | | 0 | 1,435 |
| 2,870 |
| | | 39,161 |
| |
| | 07/13/15 | | | 0 | 1,188 |
| 2,376 |
| | | 41,661 |
| 07/18/17 | | | | | | 22,953 |
| 33.75 |
| 146,670 |
|
| | 07/13/15 | | | | | 1,435 |
| | 41,658 |
| 02/09/18 | |
| | | | | 12,346 |
| | 450,012 |
|
| | | 0 |
| 218,750 |
| 437,500 |
| | | | | | 0 |
| 287,375 |
| 574,750 |
| | | | |
| Gregory J. Bylsma | 07/13/15 | | | 0 | 5,608 |
| 11,216 |
| | | 153,042 |
| 07/18/17 | | | 0 | 5,432 |
| 10,864 |
| | | 171,868 |
|
| | 07/13/15 | | | 0 | 4,642 |
| 9,284 |
| | | 162,787 |
| 07/18/17 | | | |
| | 5,432 |
| | 183,330 |
|
| | 07/13/15 | | | | | 5,608 |
| | 162,800 |
| 07/18/17 | | | | | | 28,691 |
| 33.75 |
| 183,335 |
|
| | | 0 |
| 277,487 |
| 554,974 |
| | | | | | 02/09/18 | |
| | | | | 12,757 |
| | 464,993 |
|
| | | | 0 |
| 299,688 |
| 599,376 |
| | | | | |
| Andrew J. Lock | 07/13/15 | | | | 0 | 4,355 |
| 8,710 |
| | | 118,848 |
| 07/18/17 | | | | 0 | 3,145 |
| 6,290 |
| | | 99,508 |
|
| | | 07/18/17 | | | |
| | 3,145 |
| | 106,144 |
|
| | 07/13/15 | | | 0 | 3,605 |
| 7,210 |
| | | 126,421 |
| 07/18/17 | | | | | | 16,611 |
| 33.75 |
| 106,144 |
|
| | 07/13/15 | | | | | 4,355 |
| | 126,426 |
| 02/09/18 | |
| | | | | 9,442 |
| | 344,161 |
|
| | | 0 |
| 251,853 |
| 503,706 |
| | | | | | 0 |
| 234,040 |
| 468,080 |
| | | | |
| B. Ben Watson | 07/13/15 | | | 0 | 3,316 |
| 6,632 |
| | | 90,494 |
| 07/18/17 | | | 0 | 3,200 |
| 6,400 |
| | | 101,248 |
|
| | 07/13/15 | | | 0 | 2,745 |
| 5,490 |
| | | 96,262 |
| 07/18/17 | | | |
| | 3,200 |
| | 108,000 |
|
| | 07/13/15 | | | | | 3,316 |
| | 96,263 |
| 07/18/17 | | | | | | 16,901 |
| 33.75 |
| 107,997 |
|
| | | 0 |
| 254,750 |
| 509,500 |
| | | | |
| 02/09/18 | |
| | | | | 11,797 |
| | 430,001 |
|
| | | | 0 |
| 276,938 |
| 553,876 |
| | | | |
|
| |
| (1) | Under the Annual Cash Bonus Plan, executives can earn incentive compensation based on the achievement of certain company performance goals. The actual Cash Bonus amount paid with respect to any year may range from 0 to 2 times of the target based upon the relative achievement of our EBITDA targets and areas set forth in the Summary Compensation Table above. |
| |
| (2) | The performance share units represent the right to receive shares of the Company'scompany's common stock, and such shares are to be issued to participants at the end of a measurement period beginning in the year that performance shares are granted. The units reflect the number of shares of common stock that may be issued if certain EBITDA (earnings before interest, taxes, depreciation and amortization) and TSR return goals are met. The PSU providesPSUs provide that the total number of shares which finally vest may vary between 0 and 200% of the target amount depending upon performance relative to the established EBITDA and TSR goals, respectively, and cliff vest after three years. |
| |
| (3) | The restricted stock units represent the right to receive shares of the Company'scompany's common stock. These units reflect fair market value of the common stock as of the date of grant and cliff vest after three years. |
| |
| (4) | Each option has a term of ten years and vests pro rata over three years. |
| |
| (5) | Stock options are awarded at an option price not less than the market value of the Company'scompany's common stock at the grant date in accordance with the LTI Plan. |
| |
| (6) | Aggregate grant date values are computed in accordance with FASB ASC Topic 718. For performance share units, the grant date fair value was determined based upon the vesting at 100% of the target units awarded. |
Outstanding Equity Awards at Fiscal Year-End
The Outstanding Equity Awards at Fiscal Year-End table below shows the option awards and stock awards that were outstanding as of May 28, 2016.June 2, 2018. The table shows both exercisable and unexercisable options. The table also shows share units and equity plan awards that have not vested.
|
| | | | | | | | | | | | | | | | | |
| Name | Grant Date | Option Awards | | Stock Awards |
| | | Number of Securities Underlying Unexercised Options (#)(1) Exercisable |
| Number of Securities Underlying Unexercised Options (#)(1) Unexercisable |
| Option Exercise Price ($) |
| Option Expiration Date | | Number of Shares or Units of Stock That Have Not Vested (#)(2) |
| Market Value of Shares or Units of Stock That Have Not Vested ($)(3) |
| Equity Incentive Plan Awards: Number of Unearned Shares, Units or Other Rights That Have Not Vested (#)(4) |
| Equity Incentive Plan Awards: Market or Payout Value of Unearned Shares, Units or Other Rights That Have Not Vested ($)(3) |
|
| Brian C. Walker | 07/24/06 | 20,066 |
| | 30.536 |
| 07/24/16 | | | | | |
| | 07/24/07 | 67,750 |
| | 31.840 |
| 07/24/17 | | | | | |
| | 07/18/11 | 48,280 |
| | 25.750 |
| 07/18/21 | | | | | |
| | 07/15/13 | 31,217 |
| 15,612 |
| 28.740 |
| 07/15/23 | | 18,338 |
| 580,214 |
| 30,693 |
| 971,127 |
|
| | 07/14/14 | 25,316 |
| 50,638 |
| 30.220 |
| 07/14/24 | | 20,146 |
| 637,419 |
| 34,977 |
| 1,106,672 |
|
| | 07/13/15 | | 91,070 |
| 29.030 |
| 07/13/25 | | 21,428 |
| 677,982 |
| 38,565 |
| 1,220,197 |
|
| Jeffrey M. Stutz | 07/19/10 | 1,877 |
| | 17.300 |
| 07/19/20 | | | | | |
| | 01/19/11 | 646 |
| | 25.060 |
| 01/19/21 | | | | | |
| | 07/18/11 | 1,773 |
| | 25.750 |
| 07/18/21 | | | | | |
| | 07/17/12 | 3,888 |
| | 18.170 |
| 07/17/22 | | |
|
| | |
| | 07/15/13 | | | | | | 1,076 |
| 34,045 |
| 1,801 |
| 56,984 |
|
| | 07/14/14 | | | | | | 1,119 |
| 35,405 |
| 1,943 |
| 61,477 |
|
| | 07/13/15 | | | | | | 1,457 |
| 46,099 |
| 2,623 |
| 82,992 |
|
| Gregory J. Bylsma | 07/24/07 | 2,724 |
| | 31.840 |
| 07/24/17 | | | | | |
| | 07/18/11 | 4,310 |
| | 25.750 |
| 07/18/21 | | | | | |
| | 07/17/12 | 17,907 |
| | 18.170 |
| 07/17/22 | | 3,221 |
| 101,912 |
| | |
| | 07/15/13 | |
|
| | | | 4,584 |
| 145,038 |
| 7,673 |
| 242,774 |
|
| | 07/14/14 |
|
|
| | | | 5,187 |
| 164,117 |
| 9,007 |
| 284,981 |
|
| | 07/13/15 | | | | | | 5,695 |
| 180,190 |
| 10,250 |
| 324,310 |
|
Outstanding Equity Awards at Fiscal Year-End(continued)
| | | Name | Grant Date | Option Awards | | Stock Awards | Grant Date | Option Awards | | Stock Awards |
| | | Number of Securities Underlying Unexercised Options (#)(1) Exercisable |
| Number of Securities Underlying Unexercised Options (#)(1) Unexercisable | Option Exercise Price ($) |
| Option Expiration Date | | Number of Shares or Units of Stock That Have Not Vested (#)(2) |
| Market Value of Shares or Units of Stock That Have Not Vested ($)(3) |
| Equity Incentive Plan Awards: Number of Unearned Shares, Units or Other Rights That Have Not Vested (#)(4) |
| Equity Incentive Plan Awards: Market or Payout Value of Unearned Shares, Units or Other Rights That Have Not Vested ($)(3) |
| | Number of Securities Underlying Unexercised Options (#)(1) Exercisable |
| Number of Securities Underlying Unexercised Options (#)(1) Unexercisable |
| Option Exercise Price ($) |
| Option Expiration Date | | Number of Shares or Units of Stock That Have Not Vested (#)(2) |
| Market Value of Shares or Units of Stock That Have Not Vested ($)(3) |
| Equity Incentive Plan Awards: Number of Unearned Shares, Units or Other Rights That Have Not Vested (#)(4) |
| Equity Incentive Plan Awards: Market or Payout Value of Unearned Shares, Units or Other Rights That Have Not Vested ($)(3) |
|
| Andrew J. Lock | 07/24/06 | 13,378 |
| | 30.536 |
| 07/24/16 | | | |
| Brian C. Walker | | 07/13/15 | | 30,362 |
| 29.030 |
| 07/13/25 | | 22,339 |
| 733,836 |
| 38,565 |
| 1,266,860 |
|
| | | 07/19/16 | | 150,198 |
| 31.860 |
| 07/19/26 | | 27,359 |
| 898,743 |
| 26,365 |
| 866,090 |
|
| | | 07/18/17 | | 143,975 |
| 33.750 |
| 07/18/27 | | 27,671 |
| 908,992 |
| 27,259 |
| 895,458 |
|
| Jeffrey M. Stutz | | 01/19/11 | 646 |
| | 25.060 |
| 01/19/21 | | | — |
| | — |
|
| | 07/24/07 | 9,937 |
| | 31.840 |
| 07/24/17 | | | 07/18/11 | 1,773 |
| | 25.750 |
| 07/18/21 | | | — |
| | — |
|
| | 07/18/11 | 4,199 |
| | 25.750 |
| 07/18/21 | | | 07/13/15 | | | 1,519 |
| 49,899 |
| 2,623 |
| 86,166 |
|
| | 07/17/12 | 18,292 |
| | 18.170 |
| 07/17/22 | | 2,147 |
| 67,931 |
| | 07/19/16 | 19,177 |
| 38,356 |
| 31.860 |
| 07/19/26 | | 3,800 |
| 124,830 |
| 3,662 |
| 120,297 |
|
| | | 07/18/17 | | 22,953 |
| 33.750 |
| 07/18/27 | | 4,412 |
| 144,934 |
| 4,346 |
| 142,766 |
|
| | | 02/09/18 | | | 12,415 |
| 407,833 |
| | — |
|
| Gregory J. Bylsma | | 07/18/11 | 4,310 |
| | 25.750 |
| 07/18/21 | | | — |
| | — |
|
| | | 07/13/15 | | | 5,938 |
| 195,063 |
| 10,250 |
| 336,713 |
|
| | | 07/19/16 | 22,962 |
| 45,926 |
| 31.860 |
| 07/19/26 | | 5,836 |
| 191,713 |
| 5,624 |
| 184,748 |
|
| | | 07/18/17 | | 28,691 |
| 33.750 |
| 07/18/27 | | 5,514 |
| 181,135 |
| 5,432 |
| 178,441 |
|
| | | 02/09/18 | | | 12,828 |
| 421,400 |
| | — |
|
| Andrew J. Lock | | 07/13/15 | | | 4,610 |
| 151,439 |
| 7,960 |
| 261,486 |
|
| | 07/15/13 | | | | | 3,439 |
| 108,810 |
| 5,757 |
| 182,151 |
| 07/19/16 | 16,514 |
| 33,030 |
| 31.860 |
| 07/19/26 | | 3,996 |
| 131,269 |
| 3,851 |
| 126,505 |
|
| | 07/14/14 | | | | | 4,067 |
| 128,680 |
| 7,061 |
| 223,410 |
| 07/18/17 | | 16,611 |
| 33.750 |
| 07/18/27 | | 3,193 |
| 104,890 |
| 3,145 |
| 103,313 |
|
| | 07/13/15 | | | | | 4,423 |
| 139,944 |
| 7,960 |
| 251,854 |
| 02/09/18 | | | 9,494 |
| 311,878 |
| | — |
|
| B. Ben Watson | 07/18/11 | 7,388 |
| | 25.750 |
| 07/18/21 | | | 07/18/11 | 7,388 |
| | 25.750 |
| 07/18/21 | | | — |
| | — |
|
| | 07/17/12 | 9,363 |
| | 18.170 |
| 07/17/22 | | | 07/17/12 | 9,363 |
| | 18.170 |
| 07/17/22 | | | — |
| | — |
|
| | 07/15/13 | | | | | 2,906 |
| 91,946 |
| 4,864 |
| 153,897 |
| 07/13/15 | | | 3,510 |
| 115,304 |
| 6,061 |
| 199,104 |
|
| | 07/14/14 | | | | | 3,169 |
| 100,267 |
| 5,503 |
| 174,115 |
| 07/19/16 | 13,520 |
| 27,040 |
| 31.860 |
| 07/19/26 | | 3,200 |
| 105,120 |
| 3,084 |
| 101,309 |
|
| | 08/14/14 | | | | | 414 |
| 13,099 |
| | 07/18/17 | | 16,901 |
| 33.750 |
| 07/18/27 | | 3,248 |
| 106,697 |
| 3,200 |
| 105,120 |
|
| | 07/13/15 | | | | | 3,368 |
| 106,564 |
| 6,061 |
| 191,770 |
| 02/09/18 | | | 11,863 |
| 389,700 |
| | — |
|
| |
| (1) | Options vest in three equal annual installments beginning on the first anniversary of the grant date. |
| |
| (2) | The 07/17/1202/09/18 awards issued to Mr. Bylsma for 3,221 and Mr. Lock for 2,147 reflect credited dividends through the end of fiscal 20162018 and cliff vest after fivetwo years. The remaining awards reflect credited dividends through the end of fiscal 20162018 and cliff vest after three years. |
| |
| (3) | Assumes a stock price of $31.64$32.85 per share, which was the closing price of a share of common stock on the last trading day of fiscal 2016.2018. |
| |
| (4) | The Performance Share Unit awards cliff vest after three years, depending upon the achievement of certain EBITDA and TSR return goals. |
Option Exercises and Stock Vested
This table provides information on the number and value of options exercised in fiscal 20162018 and the vesting of restricted stock (on an aggregate basis).
| | | Name | Option Awards | | | Stock Awards | | Option Awards | | Stock Awards |
| | Number of Shares Acquired on Exercise (#) | Value Realized on Exercise ($)(1) |
| | Number of Shares Acquired on Vesting (#) | Value Realized on Vesting ($)(2) |
| Number of Shares Acquired on Exercise (#) | Value Realized on Exercise ($)(1) |
| | Number of Shares Acquired on Vesting (#) | Value Realized on Vesting ($)(2) |
|
| Brian C. Walker | 63,114 | 809,121 |
| | 51,276 | 1,499,821 |
| 306,860 | 2,134,198 |
| | 55,252 | 1,892,379 |
|
| Jeffrey M. Stutz | | | | 2,947 | 86,203 |
| 5,765 | 93,469 |
| | 3,069 | 105,130 |
|
| Gregory J. Bylsma | 2,676 | 3,249 |
| | 19,350 | 565,985 |
| 20,631 | 257,951 |
| | 17,535 | 599,583 |
|
| Andrew J. Lock | | | | 20,975 | 613,511 |
| 22,491 | 312,582 |
| | 13,359 | 456,883 |
|
| B. Ben Watson | | | | 10,947 | 320,205 |
| | | | 9,118 | 311,813 |
|
| |
| (1) | Represents the difference between the exercise price and the fair market value of our common stock on the date of exercise. |
| |
| (2) | Value based on the closing market price of the Company'scompany's common stock on the vesting date. |
Pension Benefits
The Pension Benefits table below provides certain information onregarding the retirement benefits available under eachthe only retirement plan of the company that is not a defined contribution plan to eachthe only NEO that participates in the plan at the end of fiscal 2016.2018.
The retirement plans areplan is described in the Compensation Discussion and Analysis.
| | | Name | Plan Name | Number of Years Credited Service (#) |
| Present Value of Accumulated Benefit ($) |
| Payments During Last Fiscal Year ($) | Plan Name | Number of Years Credited Service (#) |
| Present Value of Accumulated Benefit ($) |
| Payments During Last Fiscal Year ($) |
Andrew J. Lock(1) | Herman Miller Limited Retirement Plan | 14 |
| 1,362,550 |
| | Herman Miller Limited Retirement Plan | 14 |
| 1,323,243 |
| |
| |
| (1) | Mr. Lock was covered from 1990-2002 and beginning again during fiscal 2011 under the UK Pension Plan.Plan which is now frozen. |
Nonqualified Deferred Compensation
The Nonqualified Deferred Compensation table below provides certain information relating to our two compensation plans that provide for the deferral of compensation on a basis that is not tax-qualified.
| | | Name | Executive Contributions in Last Fiscal Year ($)(1) |
| Registrant Contributions in Last Fiscal Year ($)(2) |
| Aggregate Earnings in Last Fiscal Year ($)(3) |
| Aggregate Withdrawals/ Distributions ($) |
| Aggregate Balance at Last Fiscal Year End ($) |
| Executive Contributions in Last Fiscal Year ($)(1) |
| Registrant Contributions in Last Fiscal Year ($)(2) |
| Aggregate Earnings in Last Fiscal Year ($)(3) |
| Aggregate Withdrawals/ Distributions ($) |
| Aggregate Balance at Last Fiscal Year End ($) |
|
| Brian C. Walker | 106,988 |
| 94,498 |
| 71,937 |
| | 2,303,247 |
| 131,876 |
| 134,835 |
| 325,032 |
| 324,477 |
| 3,295,447 |
|
| Jeffrey M. Stutz | 12,523 |
| 10,011 |
| (619 | ) | | 83,608 |
| 24,680 |
| 33,877 |
| 17,041 |
| 1,913 |
| 237,697 |
|
| Gregory J. Bylsma | 56,157 |
| 28,684 |
| 2,020 |
| (65,188 | ) | 317,750 |
| 49,089 |
| 39,364 |
| 22,591 |
| 87,751 |
| 474,141 |
|
| Andrew J. Lock | | 68,703 |
| | 304,445 |
| | 38,373 |
| | 315,411 |
|
| B. Ben Watson | 23,515 |
| 25,875 |
| (665 | ) | | 227,858 |
| 46,489 |
| 37,194 |
| 34,866 |
| | 488,511 |
|
| |
| (1) | Amounts in this column represent the deferraldeferrals of base salary earned in fiscal 20162018 which are included in Summary Compensation Table under Salary, plus deferral of amounts earned in fiscal 20152017 and paid in fiscal 20162018 under the Annual Executive Incentive Cash Bonus Plan which was included in the fiscal 20152017 Summary Compensation Table under Non-Equity Incentive Plan Compensation. |
| |
| (2) | Amounts in this column represent the Company'scompany's contribution and are included in the "All Other Compensation" column of the Summary Compensation Table. |
| |
| (3) | Amounts reflect increases (decreases) in value of the employee's account during the year, based upon deemed investment of deferred amounts. |
The Company'scompany's Nonqualified Deferred Compensation Plan, which was terminated in fiscal 2007, allowed certain employees to defer part or all of their Annual Executive Incentive Cash Bonus Plan payment each year. The Companycompany matched any such deferral, up to 50 percent of the incentive cash bonus payment. The matching payment vested over three years and vesting was dependent upon the executive remaining employed with the Company.company. Amounts deferred were converted into units having the same value as the Company'scompany's stock and were credited with amounts at the same rate as the Company'scompany's dividend on its common stock. Units are converted into shares of the Company'scompany's common stock at the time of distribution.
The Committee approved The Herman Miller, Inc. Executive Equalization Retirement Plan for salary and incentive compensation deferrals that began in January 2008, which replaced the Company'scompany's Nonqualified Deferred Compensation Plan. The Plan allows all United States employees who have compensation above the statutory ceiling to defer income in the same proportion as if the statutory ceiling did not exist. The Companycompany makes contributions to the plan such that the amounts in the plan “mirror” the amounts the Companycompany would have contributed to the Company’scompany’s tax-qualified 401(k) plan had the employee's compensation not been above the statutory ceiling. Distributions from the plan are paid out in cash based on the deferral election specified by the participant. We do not guarantee a rate of return under the Plan. Instead, participants make investment elections for their deferrals and company contributions. Investment options are the same as those available under our 401(k) plan, except for our common stock, which is not an investment option under the Plan.plan.
Potential Payments upon Termination, Death, Disability, Retirement or Change in Control
The following table quantifies both the estimated payments that would be made to each NEO in the event of his termination by the Companycompany without cause, and in the event of his termination under circumstances that would trigger payments under the change in control agreements, and upon a change in control without a termination of employment, in each case assuming that termination occurred May 28, 2016. The table also provides information regarding the incremental amounts that would have vested and become payable on May 28, 2016, if a change in control and/or termination occurred on that date or if the NEO's employment had terminated on that date because of death, disability or retirement. The amounts potentially payable to each NEO in the event of separation without cause, death, disability, or retirement or in connection with a change in control in which a termination occurs are illustrated below. The narrative that follows the tables gives more details concerning the plans and the circumstances under which either accelerated payment or vesting would occur.June 2, 2018.
| | | Name | Benefit | Death |
| Disability |
| Retirement |
| Without Cause |
| Change in Control |
| Benefit | Death |
| Disability |
| Retirement |
| Without Cause |
| Change in Control |
|
| Brian C. Walker | Cash Severance | | 1,350,000 |
| 5,400,000 |
| Cash Severance(1) (2) | | $1,462,500 | $5,850,000 |
| | Prorated Annual Incentive | | |
| | Equity | | |
| | Restricted Stock | | Prorated Annual Incentive | |
| | Restricted Stock Units | 1,895,600 |
| 1,895,600 |
| — |
| 1,125,832 |
| 1,895,600 |
| Equity | |
| | Performance Shares(1) | 1,609,675 |
| 1,609,675 |
| — |
| 1,609,675 |
| 4,072,724 |
| Restricted Stock Units | 2,541,575 |
| 2,541,575 |
| 2,427,018 |
| 1,532,427 |
| 2,541,575 |
|
| | Unexercisable Options | — |
| — |
| — |
| — |
| 354,873 |
| Performance Shares(3) (4) | 1,366,466 |
| 1,366,466 |
| | 1,366,466 |
| 2,001,056 |
|
| | Total | 3,505,275 |
| 3,505,275 |
|
|
| 2,735,507 |
| 6,323,197 |
| Unexercisable Options | | 264,679 |
|
| | Retirement Benefits(2) | | Total | 3,908,041 |
| 3,908,041 |
| 2,427,018 |
| 2,898,893 |
| 4,807,310 |
|
| | Unvested Deferred Stock Units | | Retirement Benefits | |
| | Other Benefits | | Other Benefits | |
| | Health and Welfare | | 23,400 |
| 46,800 |
| Health and Welfare(5) | — |
| — |
| — |
| 26,637 |
| 53,274 |
|
| | Outplacement | | 25,000 |
| 25,000 |
| Outplacement | — |
| — |
| — |
| 25,000 |
| 25,000 |
|
| | Total | | 48,400 |
| 71,800 |
| Total | — |
| — |
| — |
| 51,637 |
| 78,274 |
|
| | Total | 3,505,275 |
| 3,505,275 |
|
| 4,133,907 |
| 11,794,997 |
| Total | $3,908,041 | $2,427,018 | $4,413,030 | $10,735,584 |
| Jeffrey M. Stutz | Cash Severance | | 525,000 |
| 1,155,000 |
| Cash Severance(1) (2) | | $945,650 | $1,755,650 |
| | Prorated Annual Incentive | | Prorated Annual Incentive | |
| | Equity | | Equity | |
| | Restricted Stock | | Restricted Stock Units | 727,487 |
| 727,487 |
| 709,222 |
| 575,990 |
| 727,487 |
|
| | Restricted Stock Units | 115,576 |
| 115,576 |
| — |
| 66,610 |
| 115,576 |
| Performance Shares(3) (4) | 116,792 |
| 116,792 |
| | 116,792 |
| 217,967 |
|
| | Performance Shares(1) | 92,677 |
| 92,677 |
| — |
| 92,677 |
| 255,120 |
| Unexercisable Options | | 37,972 |
|
| | Unexercisable Options | | Total | 844,279 |
| 844,279 |
| 709,222 |
| 692,782 |
| 983,426 |
|
| | Total | 208,253 |
| 208,253 |
|
| 159,287 |
| 370,696 |
| Retirement Benefits | |
| | Retirement Benefits(2) | | Other Benefits | |
| | Unvested Deferred Stock Units | | Health and Welfare(5) | — |
| — |
| — |
| 6,107 |
| 8,142 |
|
| | Other Benefits | | Outplacement | — |
| — |
| — |
| 25,000 |
| 25,000 |
|
| | Health and Welfare | | 22,107 |
| 29,476 |
| Total | — |
| — |
| — |
| 31,107 |
| 33,142 |
|
| | Outplacement | | 25,000 |
| 25,000 |
| Total | $844,279 | $709,222 | $1,669,539 | $2,772,218 |
| Gregory J. Bylsma | | Cash Severance(1) (2) | | $969,767 | $1,806,767 |
| | Total | | 47,107 |
| 54,476 |
| Prorated Annual Incentive | |
| | Total | 208,253 |
| 208,253 |
|
| 731,394 |
| 1,580,172 |
| Equity | |
| | | Restricted Stock Units | 989,298 |
| 989,298 |
| 966,469 |
| 781,670 |
| 989,298 |
|
| | | Performance Shares(3) (4) | 345,823 |
| 345,823 |
| | 345,823 |
| 472,280 |
|
| | | Unexercisable Options | | 45,467 |
|
| | | Total | 1,335,121 |
| 1,335,121 |
| 966,469 |
| 1,127,493 |
| 1,507,045 |
|
| | | Retirement Benefits | |
| | | Other Benefits | |
| | | Health and Welfare(5) | — |
| — |
| — |
| 23,013 |
| 30,684 |
|
| | | Outplacement | — |
| — |
| — |
| 25,000 |
| 25,000 |
|
| | | Total | — |
| — |
| — |
| 48,013 |
| 55,684 |
|
| | | Total | $1,335,121 | $966,469 | $2,145,273 | $3,369,496 |
Potential Payments upon Termination, Death, Disability, Retirement or Change in Control(continued)
|
| | | | | | | | | | | |
| Name | Benefit | Death |
| Disability |
| Retirement |
| Without Cause |
| Change in Control |
|
| Gregory J. Bylsma | Cash Severance | | | | 645,000 |
| 1,419,000 |
|
| | Prorated Annual Incentive | | | | | |
| | Equity | | | | | |
| | Restricted Stock | | | | | |
| | Restricted Stock Units | 591,275 |
| 591,275 |
| — |
| 365,466 |
| 591,275 |
|
| | Performance Shares(1) | 406,679 |
| 406,679 |
| — |
| 406,679 |
| 1,057,354 |
|
| | Unexercisable Options | | | | | |
| | Total | 997,954 |
| 997,954 |
|
|
| 772,145 |
| 1,648,629 |
|
| | Retirement Benefits(2) | | | | | |
| | Unvested Deferred Stock Units | | | | | |
| | Other Benefits | | | | | |
| | Health and Welfare | | | | 23,400 |
| 31,200 |
|
| | Outplacement | | | | 25,000 |
| 25,000 |
|
| | Total | | | | 48,400 |
| 56,200 |
|
| | Total | 997,954 |
| 997,954 |
|
| 1,465,545 |
| 3,123,829 |
|
| Andrew J. Lock | Cash Severance | | | | 616,620 |
| 1,356,564 |
|
| | Prorated Annual Incentive | | | | | |
| | Equity | | | | | |
| | Restricted Stock | | | | | |
| | Restricted Stock Units | 445,380 |
| 445,380 |
| 422,057 |
| 272,372 |
| 445,380 |
|
| | Performance Shares(1) | 310,060 |
| 310,060 |
| 594,002 |
| 310,060 |
| 815,651 |
|
| | Unexercisable Options | | | | | |
| | Total | 755,440 |
| 755,440 |
| 1,016,059 |
| 582,432 |
| 1,261,031 |
|
| | Retirement Benefits(2) | | | | | |
| | Unvested Deferred Stock Units | | | | | |
| | Other Benefits | | | | | |
| | Health and Welfare | | | | 10,205 |
| 13,607 |
|
| | Outplacement | | | | 25,000 |
| 25,000 |
|
| | Total | | | | 35,205 |
| 38,607 |
|
| | Total | 755,440 |
| 755,440 |
| 1,016,059 |
| 1,234,257 |
| 2,656,202 |
|
| B. Ben Watson | Cash Severance | | | | 589,500 |
| 1,296,900 |
|
| | Prorated Annual Incentive | | | | | |
| | Equity | | | | | |
| | Restricted Stock | | | | | |
| | Restricted Stock Units | 91,948 |
| 91,948 |
| — |
| 86,840 |
| 91,948 |
|
| | Performance Shares(1) | 254,440 |
| 254,440 |
| — |
| 254,440 |
| 641,682 |
|
| | Unexercisable Options | | | | | |
| | Total | 346,388 |
| 346,388 |
| | 341,280 |
| 733,630 |
|
| | Retirement Benefits(2) | | | | | |
| | Unvested Deferred Stock Units | | | | | |
| | Other Benefits | | | | | |
| | Health and Welfare | | | | 4,815 |
| 6,420 |
|
| | Outplacement | | | | 25,000 |
| 25,000 |
|
| | Total | | | | 29,815 |
| 31,420 |
|
| | Total | 346,388 |
| 346,388 |
| | 960,595 |
| 2,061,950 |
|
Potential Payments upon Termination, Death, Disability, Retirement or Change in Control (continued) |
| | | | | | | | | | | |
| Name | Benefit | Death |
| Disability |
| Retirement |
| Without Cause |
| Change in Control |
|
| Andrew J. Lock | Cash Severance(1) (2) | | | | $843,060 | $1,476,786 |
| | Prorated Annual Incentive | | | | | |
| | Equity | | | | | |
| | Restricted Stock Units | 699,512 |
| 699,512 |
| 686,295 |
| 570,263 |
| 699,512 |
|
| | Performance Shares(3) (4) | 258,294 |
| 258,294 |
| | 258,294 |
| 331,510 |
|
| | Unexercisable Options | | | | | 17,986 |
|
| | Total | 957,806 |
| 957,806 |
| 686,295 |
| 828,557 |
| 1,049,008 |
|
| | Retirement Benefits | | | | | |
| | Other Benefits | | | | | |
| | Health and Welfare(5) | — |
| — |
| — |
| 8,010 |
| 10,681 |
|
| | Outplacement | — |
| — |
| — |
| 25,000 |
| 25,000 |
|
| | Total | — |
| — |
| — |
| 33,010 |
| 35,681 |
|
| | Total | $957,806 | $957,806 | $686,295 | $1,704,627 | $2,561,475 |
| B. Ben Watson | Cash Severance(1) (2) | | | | $908,848 | $1,682,848 |
| | Prorated Annual Incentive | | | | | |
| | Equity | | | | | |
| | Restricted Stock Units | 716,855 |
| 716,855 |
| 703,605 |
| 587,966 |
| 716,855 |
|
| | Performance Shares(3) (4) | 204,383 |
| 204,383 |
| | 204,383 |
| 278,879 |
|
| | Unexercisable Options | | | | | 26,770 |
|
| | Total | 921,238 |
| 921,238 |
| 703,605 |
| 792,349 |
| 1,022,504 |
|
| | Retirement Benefits | | | | | |
| | Other Benefits | | | | | |
| | Health and Welfare(5) | — |
| — |
| — |
| 18,978 |
| 25,304 |
|
| | Outplacement | — |
| — |
| — |
| 25,000 |
| 25,000 |
|
| | Total | — |
| — |
| — |
| 43,978 |
| 50,304 |
|
| | Total | $921,238 | $921,238 | $703,605 | $1,745,175 | $2,755,656 |
| |
| (1) | Performance"Without Cause" amount equals 18 months of base salary and "CIC" amount equals 3x (CEO) or 2x (Other NEOs) base salary + greater of prior year actual bonus or current year target bonus. |
| |
| (2) | Includes 2018 retention bonus (1x actual 2018 bonus amount) for all NEOs, other than the CEO. |
| |
| (3) | Actual shares vestearned are based on actual performance estimated performance atthrough the end of the performance period for outstanding performance share units (PSUs) where more than 50% of the performance period has elapsed and target for outstanding PSUs where less than 50% of the performance period has elapsed. For PSUs with a performance period ending after June 2, 2018 (our 2018 fiscal year 2016 are as follows:end), the following performance estimates were used: Relative TSR performance shares granted in 2013 = 81.41% of target, Herman Miller Value Added performance shares granted in 2013 = 138% of target, TSR performance shares granted in 2014 = 70.45% of target, Herman Miller Value Added performance shares granted in 2014 = 95% of target, TSR performance sharesPSUs granted in 2015 = 200% of target, and Herman Miller Value Added performance sharesPSUs granted in 20152016 = 140%0% of target.target, Herman Miller Value Added PSUs granted in 2017 =100% of target (less than 50% of the performance period has elapsed). |
| |
(2)(4) | The retirement benefits availableThere is no accelerated vesting of performance share units or stock options under a "Retirement" scenario (awards either continue to the Named Executive Officersvest or are the same as those available to all salaried employees.pro-rated for time employed since grant). |
| |
| (5) | "Without Cause" amount equals 18 months of benefits continuation and "CIC" amount equals 36 months (CEO) or 24 months (Other NEOs) benefits continuation. |
Potential Payments upon Termination without Change in Control
The Companycompany under its salary continuation plan has agreed to pay Corporate Officerscorporate officers and other executives severance if they are terminated for reasons other than cause. The payments are equal to 18 monthsmonths' base salary continuation for the NEOs. In addition, the Companycompany maintains the health insurance on such employee during the salary continuation period. In exchange for such payments, the employee provides the Companycompany with a mutual release of all claims and agrees not to work for a competitor during the salary continuation period. In the event of a termination covered by the change in control agreements described below, the payments under those agreements isare reduced by any amounts received under the salary continuation plan.
The Executive Long-Term Disability Plan provides a monthly benefit to an executive of 60% of their two yearhis two-year average executive incentive up to a monthly maximum of $10,000. Each of the NEOs would be entitled to a $10,000 monthly benefit if theyhe became disabled as of May 28, 2016June 2, 2018, for as long as they arehe is disabled or until age 65.
Potential Payments upon Termination, Death, Disability, Retirement or Change in Control (continued)
Potential Payments upon Termination in Connection with Change in Control
In fiscal 2016,2018, each NEO was party to a change in control agreement with the Company.company. The change in control agreements are all “dual“double trigger” agreements. This means therethat both these must be a change in control and the employee must incur an actual or constructive termination of employment by us to be entitled to a payment.
The agreements define change in control as having occurred (1) when a third party becomes the owner of 35 percent or more of the Company'scompany's stock, (2) when a majority of the Board of Directors is composed of persons who are not recommended by the existing Board, or (3) under certain transactions involving a merger or reorganization, sale of all or substantially all of the company's assets or a liquidation in which the Companycompany does not maintain certain control thresholds.
An employee is entitled to a payment under the change in control agreement if within 2 years after a change in control he or she (1) has his or her employment with the Companycompany terminated by the Companycompany for reasons other than cause or (2) voluntarily terminates his or her employment if (a) the responsibilities of his or her job are significantly reduced, (b) the base salary or bonus he or she receives is reduced, (c) the benefits he or she receives are reduced by more than 5 percent, (d) the location of his or her job is relocated more than 50 miles from its current location, or (e) the obligations of the change in control agreement isagreements are not assumed by any successor company.
If both triggering events occur, then the NEO is entitled to a change in control payment. The change in control payment consists of three elements (1) amounts owed for current year base salary, on targeton-target bonus prorated to the date of termination and all amounts of deferred income, (2) medical and other insurance benefits, and (3) a separation payment. In addition, all existing unvested options and other equity units become immediately vested and exercisable. The separation payment in the case of the CEO is to be equal to three times the amount described below and in the case of all other NEOs the payment is equal to two times the amount described below. The separation payment is a lump sum equal to either two or three times the sum of (a) the executive's base salary plus (b) the greater of the executive's actual bonus for the preceding year or his or her on-target bonus for the current year. This amount is reduced by any severance payment that executive receives under the severance programbenefit described above.
The Companycompany has no obligation to make a “gross up” payment to the executive if the amount of the payments under the change in control agreements is subject to an excise tax under Section 4999 of the Internal Revenue Code of 1986.
To receive the payments, the NEO is obligated to comply with the non-competition covenant of the agreement, committing him or her to refrain from competing with the Companycompany for a period equal to the number of years of compensation received by the NEO under the agreement.
Accelerated Vesting upon Death, Disability, Retirement or Change in Control
Various compensation plans contain provisions that permit accelerated vesting upon death, disability or change in control. In the event of a change in control, the Key Executive Deferred Compensation Plan the Long-Term Incentive Plan, and the Executive Incentive Cash Bonus Plan provide for the acceleration of vesting and/or payment even if the NEO has not been terminated. In addition, the vesting of each restricted stock unit and performance share unit will accelerate upon a change in control under the terms of the award agreements. These are so-called single trigger payment
Potential Payments upon Termination, Death, Disability, Retirement or Change provisions. These so-called single trigger payments will no longer exist starting with grants in Control (continued)
provisions.July 2018. The Long-Term Incentive Plan, Executive Incentive Cash Bonus Plan and Key Executive Deferred Compensation Plan each has provisions dealing with vesting upon death, disability or retirement. The definition of change in control for these plans is the definition contained in Treasury Regulations for Section 409A of the Internal Revenue Code.
Key Executive Deferred Compensation Plan
The Key Executive Deferred Compensation Plan, which terminated in fiscal 2007, permits a participant to elect to have his or her account distributed immediately upon his or her death, disability, or termination of employment in addition to change in control. The plan also permits the Committee to distribute to the employee amounts deferred before December 31, 2005 in the event of his death, disability or termination of employment.
Potential Payments upon Termination, Death, Disability, Retirement or Change in Control (continued)
Long-Term Incentive Plan
Change in Control
Under our 2011 Long-Term Incentive Plan, except as otherwise provided in an award agreement, inawards that are outstanding at the eventtime of a change in control transaction, will accelerate and immediately vest if (1) awards that are not assumed or continued (other than performance-based awards)by the surviving corporation or (2) if the participant’s employment is terminated without cause or by the participant with good reason within a one-year period following the change in control. However, all our award agreements for currently outstanding awards provide that the awards will vest immediately upon a change in control. Going forward starting in July 2018, all awards shall be deemed to be immediately vested, or at the Committee's election, it may cancel those awards and pay the value of those awards to participants. Withdouble-trigger awards. Specifically, with respect to performance-based awards, under a change in control transaction in which awards are not assumed,, if less than half the performance period has lapsed, those awards will be converted into shares or similar securities assuming target performance has been achieved. If at least half of the performance period has lapsed, those performance-based awards will be converted into shares or similar securities based upon actual performance-to-date. Conversely, and except as otherwise provided in an award agreement,We quantify the benefits that each named executive officer would receive upon a change in control in which the Company istable under the surviving entityheading "Potential Payments upon Termination, Death, Disability, Retirement or under which outstanding awards are assumed or continued, the Plan provides for a corresponding adjustment to the outstanding awards to preserve the intrinsic value of those awards; those outstanding awards will be subject to accelerated vesting if, within a one-year period following the changeChange in control, the participant's employment is terminated without cause or the participant terminates for good reason.Control."
Death, Disability and Retirement
Options granted under the LTI Plan to the extent vested at the date of death or disability remain exercisable for the balance of their original term but not more than 60 months following the date of termination of employment. If an employee retires, the options granted prior to fiscal 2013 to the extent vested remain exercisable for the balance of their original term but not more than 60 months following the date of termination of employment. For options granted beginning in fiscal 2013, the grant will be prorated over 12 months if retiring within one year of the grant; after the initial 12 months, they will vest in full. They remain exercisable for the balance of their original term but not more than 60 months following the date of termination of employment. In all other cases, the vested options terminate three months after the termination of employment.
In the case of restricted stock units, if an employee dies or becomes disabled, units vest immediately. All vest ratably if the employee is terminated for reasons other than cause. Vesting is determined by comparing the number of months the employee has been with the Companycompany between the date of grant and the date of termination to the original vesting period. If an employee retires, units will be prorated over 12 months if retiring within one year of the grant; after the initial 12 months, they will vest in full.
Performance shares, as explained earlier, are granted at a target value and the actual number of units converted into shares is determined at the end of a 3 year3-year measurement period. The percentage of the performance share target grant that is eligible to vest if an employee dies, becomes disabled, or is terminated for reasons other than cause is determined by comparing the number of months between the date of grant and the date of termination to the original vesting period. If an employee retires in the first year, the percentage of thetarget performance share target grant subject to vesting will be equal to the number of months the employee remains employed during the year divided by 12.prorated over 12 months. If the employee retires after the first year, 100 percent of the target performance share grant is subject to vesting.
The Executive Incentive Cash Bonus Plan
The Executive Incentive Cash Bonus Plan requires that an employee be employed by the Companycompany on the last day of a fiscal year to be eligible to receive the Incentive Cash Bonus,incentive bonus, with certain exceptions noted below. The plan provides that in the events of death, disability or retirement an employee does not need to be employed on the last day of the fiscal year to receive a bonus. The employee's bonus will be reduced to reflect the portion of the year that he or she was employed by the Company.company. In the event of a change in control, the Incentive Cash Bonusincentive bonus is immediately vested (based upon EBITDA results achieved through the date of the change in control) and payable and is not reduced by virtue of the fact that it is calculated upon a partial year. The same provisions governing payment in the event of death, disability, retirement or change in control are also found in the bonus plan applicable to all other employees.
Pay Ratio
Pursuant to the SEC’s guidance under Item 402(u) of Regulation S-K, we are required to disclose the annual total compensation for both our Chief Executive Officer and median employee and the ratio of those two amounts. For 2018:
The annual total compensation of our Chief Executive Officer was $4,728,041.
The annual total compensation of our identified median employee was $47,721.
The ratio of the annual total compensation of our Chief Executive Officer to that of our identified median employee was 99 to 1.
The methodology we used to identify our median employee is summarized in the following table:
|
| |
| Item | Description |
| Determination Date | March 31, 2018 |
| Employee Population | Total employee population (excluding the CEO) as of the determination date was 7,626 |
| Consistently Applied Compensation Measure (CACM) | Gross wages, measured over the twelve-months ending on the determination date. For new hires, we annualized gross wages for any employees hired during the twelve-month period ending on March 31, 2018. For non-U.S. employees, values were converted into U.S. Dollars using the exchange rates in effect on the determination date |
Director Compensation
The following Director Compensation table provides information on the compensation of each director for fiscal 2016.2018. The standard annual compensation of each director is $155,000 (prorated if a director serves for less than a full year).$175,000. The Audit Committee Chair receives an additional $20,000, the Executive Compensation Committee Chair receives an additional $15,000 and the Nominating and Governance Committee Chair receives an additional $10,000. Non-chair members of the Audit Committee receive an additional $8,000 per year, non-chair members of the Executive Compensation Committee receive an additional $6,000 per year, and non-chair members of the Nominating and Governance Committee receive an additional $4,000 per year due to the increased workload of these committees. The Chairman of the Board of Directors receives additional annual compensation of $155,000$75,000 and is eligible to participate in the Company'scompany's health insurance plan. Brian Walker, the Company'scompany's CEO, does not receive any additional compensation for serving on the Board of Directors.
The annual retainer and any chairperson or additional fees (collectively, the "Annual Fee") is payable by one or more of the following means, as selected by each director: (1) in cash; (2) in shares of our stock valued as of January 15 of each year; (3) credit under the Director Deferred Compensation Plan described below; (4) stock options valued as of January 15 of each year under the Black-Scholes Valuation Model; or (5) as a contribution to our Companycompany employee scholarship fund. Any director who does not meet the stock ownership guidelineguidelines must take at least 50 percent of his or her Annual Fee in one of the permissible forms of equity.
Stock Compensation Plan
Under our 2011 Long-Term Incentive Plan, nonemployee officers and directors may be granted options to purchase shares of our stock if they elect to receive their compensation in stock options. Subject to certain exceptions, the options are not exercisable until 12 months afterprior to the datefirst anniversary of grantthe award date and expire 10 years after the date of the grant. The option price is payable upon exercise in cash or, subject to certain limitations, in shares of our stock already owned by the optionee, or a combination of shares and cash.
Deferred Compensation Plan
We also maintain a Nonemployee Officer and Director Deferred Compensation Stock Purchase Plan. The Plan permits a participant to defer receipt of all or a portion of his or her Annual Fee to his or her deferred account. The account is held in a Rabbi Trust. Each account is credited with a number of stock units equal to a number of shares of the investment selected by the director including Companycompany stock and other investment alternatives. The initial value of the deferral is equal to the dollar amount of the deferral, divided by the per share fair market value of the selected investment at the time of the deferral. The units are credited with any dividends paid on the investment. The company maintains a Rabbi-Trust relating to obligations under this plan.
Director Compensation (continued)
Stock Ownership Guidelines
Director stock ownership guidelines have been in effect since 1997. These guidelines, like those ofapplicable to the management team, are intended to reinforce the importance of linking shareholder and director interests. Under these guidelines, beginning in 2000, each director is encouraged to reach a minimum level of share ownership having a value of at least three times the annual director retainer over a five-year period after first becoming a director.
Other
Directors are reimbursed for travel and other necessary business expenses incurred in the performance of their services for the Company,company, and they are covered under the Company'scompany's business travel insurance policies and under the Director and Officer Liability Insurance Policy.
Perquisites
Some directors' spouses accompany them to Board meetings. The Companycompany pays for their expenses and for some amenities for the Directors and their spouses, including some meals and social events. The total of these perquisites is less than $10,000 per Director. Directors are approved to purchase Company productcompany products under employee discount pricing. The value of this perquisite was less than $10,000 for all but one Director whosetwo Directors as to whom the value has been included in All Other Compensation in the Director Compensation Table.
Director Compensation (continued)
Director Compensation Table
| | | Name | Fees Earned or Paid in Cash ($)(1) |
| Stock Awards ($)(2) |
| Option Awards ($)(2) | Non-Equity Incentive Plan Compensation ($) | Change in Pension Value and Nonqualified Deferred Compensation Earnings | All Other Compensation ($)(3) |
| Total ($) |
| Fees Earned or Paid in Cash ($)(1) |
| Stock Awards ($)(2) |
| Option Awards ($)(2) | All Other Compensation ($)(3) |
| Total ($) |
|
| Mary Vermeer Andringa | 59,000 |
| 100,000 |
| | | 159,000 |
| 85,000 |
| 100,000 |
| | | 185,000 |
|
| David A. Brandon | 76,000 |
| 85,000 |
| | 72,000 |
| 233,000 |
| 181,000 |
| | | 25,907 |
| 206,907 |
|
| Brenda Freeman | 155,000 |
| | | | 155,000 |
| 179,000 |
| | | | 179,000 |
|
| Douglas D. French | 163,000 |
| | | | 163,000 |
| 183,000 |
| | | | 183,000 |
|
| J. Barry Griswell | 45,000 |
| 125,000 |
| | | 170,000 |
| 75,000 |
| 115,000 |
| | | 190,000 |
|
| John R. Hoke III | 90,000 |
| 71,000 |
| | | 161,000 |
| 181,000 |
| | | 13,203 |
| 194,203 |
|
| Lisa A. Kro | 87,500 |
| 87,500 |
| | | 175,000 |
| 145,000 |
| 50,000 |
| | | 195,000 |
|
| Heidi Manheimer | 81,500 |
| 81,500 |
| | | 163,000 |
| 90,000 |
| 93,000 |
| | | 183,000 |
|
| Dorothy A. Terrell | 165,000 |
| | | | 165,000 |
| |
| David O. Ulrich | 159,000 |
| | | | 159,000 |
| |
| Michael A. Volkema | 310,000 |
| | | | 310,000 |
| 250,000 |
| | | | 250,000 |
|
| |
| (1) | The amounts shown in the “Fees Earned or Paid in Cash” column include amounts that may be deferred under the Non-employee Officer and Director Deferred Compensation Plan. Amounts deferred are retained as units equal to shares of stockassociated with hypothetical investments under the plan. The plan permits non-employee directors to elect to defer amounts that they would otherwise receive as director fees. Directors at the time of deferral elect the deferral period. These amounts may also reflect contributions to the Michael Volkema Scholarship fund which awards college scholarships to children of employees. During fiscal 2016, ten2018, seven of the directors who received fees contributed a portion to the fund. |
| |
| (2) | Amounts represent the aggregate grant date fair value of stock awards and option awards computed in accordance with FASB ASC Topic 718. The assumptions used in calculating these amounts are set forth in Note 9, in the Company'scompany's consolidated financial statements for the fiscal year ended May 28, 2016,June 2, 2018, included in our Annual Report on Form 10-K. |
| |
| (3) | Represents value received on product purchases under employee discount program. |
As of May 28, 2016,June 2, 2018, each Director had the following aggregate number of outstanding options:
|
| | |
| Name | Aggregate Number of Outstanding Options |
|
| Mary Vermeer Andringa | — |
|
| David A. Brandon | — |
|
| Douglas D. French |
— |
|
| J. Barry Griswell | — |
|
| John R. Hoke III | — |
|
| Lisa A. Kro | — |
|
| Heidi Manheimer | |
Dorothy A. Terrell | 19,083 |
|
David O. Ulrich | 38,048— |
|
| Michael A. Volkema | — |
|
Equity Compensation Plan Information
As noted in the Compensation Discussion and Analysis, we maintain certain equity compensation plans under which common stock is authorized for issuance to employees and directors in exchange for services. We maintain our 2011 Long-Term Incentive Plan (LTI Plan) and Employees' Stock Purchase Plan.
The following table sets forth certain information regarding the above referenced equity compensation plans as of May 28, 2016.June 2, 2018.
| | | Plan Category | Number of securities to be issued upon exercise of outstanding options, warrants and rights |
| Weighted-average exercise price of outstanding options, warrants and rights |
| Number of securities remaining available for future issuance under equity compensation plans (excluding securities reflected in column (a)) | Number of securities to be issued upon exercise of outstanding options, warrants and rights |
| Weighted-average exercise price of outstanding options, warrants and rights |
| Number of securities remaining available for future issuance under equity compensation plans (excluding securities reflected in column (a)) |
|
| | (a) |
| (b) |
| (c) | (a) |
| | |
| Equity compensation plans approved by security holders | 1,732,979 |
| $ | 25.6388 |
| 4,241,420(1) | 1,922,049 |
| $ | 30.6345 |
| 3,689,364 |
|
| Equity compensation plans not approved by security holders | | | | | | |
| Total | 1,732,979 |
| $ | 25.6388 |
| 4,241,420(1) | 1,922,049 |
| $ | 30.6345 |
| 3,689,364 |
|
| |
| (1) | The number of shares that remain available for future issuance under our plans is 4,241,4203,689,364 which includes 3,113,7982,697,625 under the Long-Term Incentive Plan and 1,127,621991,739 under the Employees' Stock Purchase Plan. |
Section 16(a) Beneficial Ownership Reporting Compliance
Our directors and officers, as well as any person holding more than 10 percent of our common stock, are required to report initial statements of ownership of our securities and changes in such ownership to the Securities and Exchange Commission.SEC. Based upon written representations by each director and officer, all the reports were timely filed by such persons during the last fiscal year.year except for Andrew Lock who had one delinquent filing representing three same-day-sale stock option exercises and H. Timothy Lopez who had one delinquent filing representing one award vest.
Certain Relationships and Related Party Transactions
The Board of Directors has adopted a written policy on Related Party Transactions. Under that policy, with certain limited exceptions, all proposed transactions between the Companycompany and any directors or officers or their respective affiliates are required to be reported to the Nominating and Governance Committee prior to entering into such a transaction. Management is obligated to provide the Nominating and Governance Committee with information relating to the terms and conditions of the proposed transaction, how it complies with the policy, and if the proposed transaction is with a director, advise the Nominating and Governance Committee if the transaction would impact that director's status as an independent director. The Nominating and Governance Committee has the authority to determine whether the proposed transaction is exempt from approval or, if not, whether to approve the transaction as compliant with the policy or refer the matter to the Board of Directors. All approved or exempted transactions must be reported by the Nominating and Governance Committee to the full Board of Directors.
To approve a transaction under the policy, the Nominating and Governance Committee must determine that either (1) the dollar amount of the transaction and other transactions with the director during that year is less than $100,000 and, for any director that is a member of the Audit Committee, does not constitute a proscribed consulting, advisory, or other compensated fee, or (2) if the proposed transaction is for the acquisition of products or services and is less than $100,000 or is subject to a bid process involving three or more competing parties, and the transaction is in the best interest of the Companycompany and its shareholders, provided that (a) management determined that the proposed transaction will provide the best value for the Company,company, (b) the compensation is consistent with the proposals submitted by the other bidders, and (c) the director did not directly participate in the proposal process.
Reconciliation of Non-GAAP Financial Measures
This report contains certain non-GAAP financial measures; includingreferences to Adjusted Earningsdiluted earnings per Shareshare ("EPS"), Organic Sales Growthnet sales and Adjusted EBITDA.
operating earnings and Adjusted EBITDA, all of which are non-GAAP financial measures (referred to collectively as the "Adjusted financial measures"). Adjusted diluted EPS isand Adjusted operating earnings are calculated by excluding from Earnings per Shareshare - diluted and Operating earnings items that we believe are not indicative of our ongoing operating performance. Such items consist of the following:
Non-recurring gains
One-time tax impacts
Expensesperformance, such as non-recurring gains; expenses associated with restructuring actions taken to adjust our cost structure to the current business climate
Non-cashclimate; other special charges not indicative of ongoing performance such as costs associated with the CEO transition plan announced in fiscal 2018; and non-cash impairment expenses, and
Acquisition-related inventory adjustments and other acquisition expenses
expenses. Organic Sales Growthnet sales represents the change in sales excluding currency translation effects, the divestiture of owned dealers, the impact of the change in DWR shipping terms in fiscal 2018 and the impact of an extra week of operations in fiscal 2017 as well ascompared to fiscal 2018. Adjusted EBITDA is calculated by excluding depreciation and amortization from Adjusted Operating Earnings (Loss) and including equity income and other income and expenses. These adjustments are made to provide enhanced comparability of the impacts of acquisitions and divestitures, if applicable. We presentcompany's current results with historical results.
The company presents the Adjusted EPS and Organic Sales Growthfinancial measures because we consider them to be important supplemental measures of our performance and believe them to be useful in analyzing ongoing results from operations. Adjusted EPS and Organic Sales GrowthThe adjusted financial measures are not measurements of our financial performance under GAAP and should not be considered an alternative to EPS and Reported Sales GrowthEarnings per share - diluted, Operating earnings or the company's reported Net sales under GAAP. The Adjusted EPS and Organic Sales Growthfinancial measures have limitations as analytical tools and should not be considered in isolation or as a substitute for analysis of ourthe company's results as reported under GAAP. OurThe company's presentation of the Adjusted EPS and Organic Sales Growthfinancial measures should not be construed as an indication that ourits future results will be unaffected by unusual or infrequent items. We compensateThe company compensates for these limitations by providing prominence of ourthe GAAP results and using adjusted resultsthe Adjusted financial measures only as a supplement.
Adjusted EBITDA is calculated by excluding depreciation, amortization, interest expense, income taxes and other net income or expense from Current Year Net Income.
The following table reconciles EPS to Adjusted EPS for the fiscal years indicated:
|
| | | | | | |
| | Fiscal Year Ended |
| | May 28, 2016 | May 30, 2015 |
| Earnings per Share - Diluted | $ | 2.26 |
| $ | 1.62 |
|
| Less: Non-recurring gains | (0.09 | ) | |
| Less: One-time tax impact | | (0.07 | ) |
| Add: Restructuring and impairment expense | — |
| 0.17 |
|
| Add: Acquisition-related inventory adjustments | — |
| 0.08 |
|
| Add: Acquisition expenses | — |
| 0.02 |
|
| Adjusted EPS | $ | 2.17 |
| $ | 1.82 |
|
|
| | | | | | |
| | June 2, 2018 |
| June 3, 2017 |
|
| Earnings per Share - Diluted | $ | 2.12 |
| $ | 2.05 |
|
| | | |
| Less: One-time impact of adopting U.S. Tax Cuts and Job Acts | (0.05 | ) | — |
|
| Add: Other special charges | 0.16 |
| — |
|
| Less: Gain on sale of dealer | — |
| (0.02 | ) |
| Add: Impairment charges | — |
| 0.07 |
|
| Add: Restructuring expenses | 0.07 |
| 0.06 |
|
| Adjusted Earnings Per Share - Diluted | $ | 2.30 |
| $ | 2.16 |
|
| Weighted average shares outstanding (used for calculating Adjusted Earnings per share) | 60,311,305 |
| 60,554,589 |
|
The following table reconciles Net Sales to Organic net sales by segment for the ELA segment to Organic Sales Growth for the segment:fiscal years ended:
|
| | | | | | |
| | Fiscal Year Ended |
| (Dollars In millions) | May 28, 2016 | May 30, 2015 |
| Net Sales ELA Segment, as reported | $ | 412.6 |
| $ | 409.9 |
|
| Proforma Adjustments | | |
| Currency Translation Effects | 26.1 |
| |
| Net Sales ELA Segment, proforma | $ | 438.7 |
| $ | 409.9 |
|
| % Change from Prior Year | 7.0 | % | 8.8 | % |
|
| | | | | | | | | | | | | | | | | | | | | | | | | | | | | | |
| | June 2, 2018 | June 3, 2017 |
| | North America | ELA | Specialty | Consumer | Total | North America | ELA | Specialty | Consumer | Total |
| Net Sales, as reported | $ | 1,284.4 |
| $ | 434.5 |
| $ | 305.4 |
| $ | 356.9 |
| $ | 2,381.2 |
| $ | 1,276.6 |
| $ | 385.5 |
| $ | 298.0 |
| $ | 318.1 |
| $ | 2,278.2 |
|
| % change from PY | 0.6 | % | 12.7 | % | 2.5 | % | 12.2 | % | 4.5 | % | | | | | |
| Proforma Adjustments | | | | | | | | | | |
| Dealer divestitures | — |
| — |
| — |
| — |
| — |
| (25.8 | ) | — |
| — |
| — |
| (25.8 | ) |
Currency translation effects (1) | (3.9 | ) | (12.6 | ) | (0.1 | ) | (0.2 | ) | (16.8 | ) | — |
| — |
| — |
| — |
| — |
|
| Impact of extra week in FY17 | — |
| — |
| — |
| — |
| — |
| (21.7 | ) | (6.3 | ) | (4.3 | ) | (4.7 | ) | (37.0 | ) |
| Impact of Change in DWR Shipping Terms | — |
| — |
| — |
| (5.0 | ) | (5.0 | ) | | | | | |
| Organic net sales | $ | 1,280.5 |
| $ | 421.9 |
| $ | 305.3 |
| $ | 351.7 |
| $ | 2,359.4 |
| $ | 1,229.1 |
| $ | 379.2 |
| $ | 293.7 |
| $ | 313.4 |
| $ | 2,215.4 |
|
| % change from PY | 4.2 | % | 11.3 | % | 3.9 | % | 12.2 | % | 6.5 | % | | | | | |
(1) Currency translation effects represent the estimated net impact of translating current period sales using the average exchange rates applicable to the comparable prior year period.
Reconciliation of Non-GAAP Financial Measures (continued)
The following table reconciles Operating earnings to Adjusted operating earnings by segment for the fiscal years ended:
|
| | | | | | | | | | | | | | | | | | | | | | | | | | | | | | | | | | | | |
| | June 2, 2018 | June 3, 2017 |
| | North America | ELA | Specialty | Consumer | Corporate | Total | North America | ELA | Specialty | Consumer | Corporate | Total |
| Operating earnings (loss) | $ | 166.3 |
| $ | 35.5 |
| $ | 8.9 |
| $ | 13.9 |
| $ | (47.1 | ) | $ | 177.5 |
| $ | 176.0 |
| $ | 35.9 |
| $ | 8.1 |
| $ | 4.8 |
| $ | (34.0 | ) | $ | 190.8 |
|
| % Net sales | 12.9% | 8.2% | 2.9% | 3.9% | n/a | 7.5% | 13.8% | 9.3% | 2.7% | 1.5% | n/a | 8.4% |
| | | | | | | | | | | | | |
| Add: Special charges | — |
| 2.5 |
| — |
| | 11.3 |
| 13.8 |
| — |
| — |
| — |
| — |
| — |
| — |
|
| Add: Impairment charges | — |
| — |
| — |
| — |
| — |
| — |
| — |
| — |
| 7.1 |
| — |
| — |
| 7.1 |
|
| Less: Gain on sale of dealer | — |
| — |
| — |
| — |
| — |
| 5.7 |
| (0.7 | ) | — |
| — |
| — |
| — |
| (0.7 | ) |
| Add: Restructuring expenses | 1.8 |
| 3.9 |
| — |
| — |
| — |
| | 2.9 |
| 1.0 |
| 0.9 |
| 0.6 |
| — |
| 5.4 |
|
| Adjusted operating earnings (loss) | $ | 168.1 |
| $ | 41.9 |
| $ | 8.9 |
| $ | 13.9 |
| $ | (35.8 | ) | $ | 197.0 |
| $ | 178.2 |
| $ | 36.9 |
| $ | 16.1 |
| $ | 5.4 |
| $ | (34.0 | ) | $ | 202.6 |
|
The following table reconciles Current Year Net Income to Adjusted EBITDA used for the Annual Executive Incentive Cash Bonus:Bonus Plan:
|
| | | |
| | Fiscal Year Ended |
| (Dollars In millions) | May 28, 2016 |
| Current Year Net Income | $ | 136.7 |
|
| Standard Add Backs: | |
| Interest Expense | 15.4 |
|
| Income Taxes | 59.5 |
|
| Depreciation and Amortization | 53.0 |
|
| EBITDA | $ | 264.6 |
|
| Standard Adjustments per Guidelines |
|
|
| Amortization of Previously Excluded Restructuring | (0.8 | ) |
| Non-Standard Adjustments Requiring Approval | |
| Gain on Sale of UK Facility | (4.0 | ) |
| Gain on Divestiture of Australian Dealership | (2.1 | ) |
| Adjusted EBITDA | $ | 257.7 |
|
|
| | | |
| | Fiscal Year Ended |
| (Dollars In millions) | June 2, 2018 |
| Current Year Net Income | $ | 128.1 |
|
| Standard Add Backs: | |
| Interest Expense | 13.5 |
|
| Income Taxes | 42.4 |
|
| Depreciation and Amortization | 66.9 |
|
| EBITDA | $ | 250.9 |
|
| Standard Adjustments per Guidelines | |
| Amortization of Previously Excluded Restructuring | (1.9 | ) |
| Non-Standard Adjustments Requiring Approval | |
| Restructuring expense | 8.2 |
|
| Third party consulting costs, net of amortization | 4.8 |
|
| Costs associated with the CEO transition plan | 4.4 |
|
| Adjusted EBITDA | 266.4 |
|
Submission of Shareholder Proposals for the 2017 Annual Meeting
Shareholders wishing to submit proposals on matters appropriate for shareholder action to be presented at our 2017 Annual Meeting of Shareholders and to be included in our proxy materials for that meeting may do so in accordance with Rule 14a-8 promulgated under the Exchange Act, whereby (1) all applicable requirements of Rule 14a-8 must be satisfied, (2) the notice must include various stock ownership and related information detailed in our Bylaws, and (3) such proposals must be received by us at our principal executive offices at 855 East Main Avenue, PO Box 302, Zeeland, Michigan 49464-0302, no later than May 2, 2017.
Our bylaws, which are available on our website at www.hermanmiller.com/bylaws, contain certain procedural requirements that shareholders must follow to nominate a person for election as a director at an annual meeting or to bring an item of business before the annual meeting. These procedures require that notice of an intention to nominate a person for election to the Board and/or to bring an item of business before our 2017 annual meeting must be received in writing by our secretary at 855 East Main Avenue, PO Box 302, Zeeland, Michigan 49464-0302 no earlier than June 12, 2017 and no later than July 12, 2017. The notice must contain certain information about the shareholder making the proposal for nomination, including a representation that the shareholder intends to appear in person or by proxy at the annual meeting to nominate the person named in the notice or bring the item of business before the meeting, and about the nominee and/or the item of business and, in the case of a nomination, must be accompanied by a written consent of the proposed nominee to be named as a nominee and to serve as a director, if elected. We did not receive any proposals to be presented at the 2016 Annual Meeting.
Miscellaneous
The cost of the solicitation of proxies will be borne by us. In addition to the use of the mails, proxies may be solicited personally or by telephone or electronic means by a few of our regular employees. We may reimburse brokers and other people holding stock in their names or in the names of nominees for their expenses in sending proxy materials to the principals and obtaining their proxies.
Our mailing for the fiscal year ended May 28, 2016,June 2, 2018, includes the Notice Regarding the Availability of Proxy Materials. A copy of the Notice of 20162018 Annual Meeting of Shareholders and the 20162018 Form 10-K (Annual Report) as well as the Proxy Statement, both filed with the Securities and Exchange Commission,SEC, are available, without charge, upon written request from the Secretary of the Company, 855 East Main Avenue, PO Box 302, Zeeland, Michigan 49464-0302.
Shareholders are urged to vote promptly. Questions related to your registered holdings can be directed as follows:
Computershare Investor Services, LLC, 250 Royall Street, Canton, Massachusetts 02021 Phone: 1-866-768-5723 inside the United States Phone: 1-781-575-2723 outside the United States http://www.computershare.com
By Order of the Board of Directors
H. Timothy Lopez, Secretary
August 30, 201628, 2018
56 201658 2018 Proxy Statement